5TH WAVE. The fifth wave of the Covid-19 epidemic started at the beginning of November 2021. The incidence rate has sharply increased and has exceeded the level reached in previous waves, but hospital indicators are to date lower than those observed during waves 2 and 3. A look back at the key dates of the epidemic peaks.
[Mis à jour le 17 décembre 2021 à 15h23] The Covid-19 epidemic spread like a bushfire in France in early 2020 before evolving in waves depending on restrictions such as containments (March-May 2020, October-December 2020, April-May 2021), curfew, closures restaurants … then reopening and above all, vaccination. 5 waves are recorded between March 2020 and the end of 2021, marked by the influx of patients in hospital and intensive care. The fifth wave of the COVID-19 epidemic started in early November 2021. The incidence rate increased sharply and exceeded the level reached in previous waves. “However, the hospital indicators are so far lower to those observed during waves 2 and 3, when vaccines were not yet available on a large scale, highlighted Public Health France December 16. However, it should be remembered that hospital tensions remain very present, with the deployment of the White Plan in several regions. “ Curve of the first wave, the second, third, fourth and fifth, peak, hospitalizations… Here is the evolution of the Covid epidemic in France with its key dates.
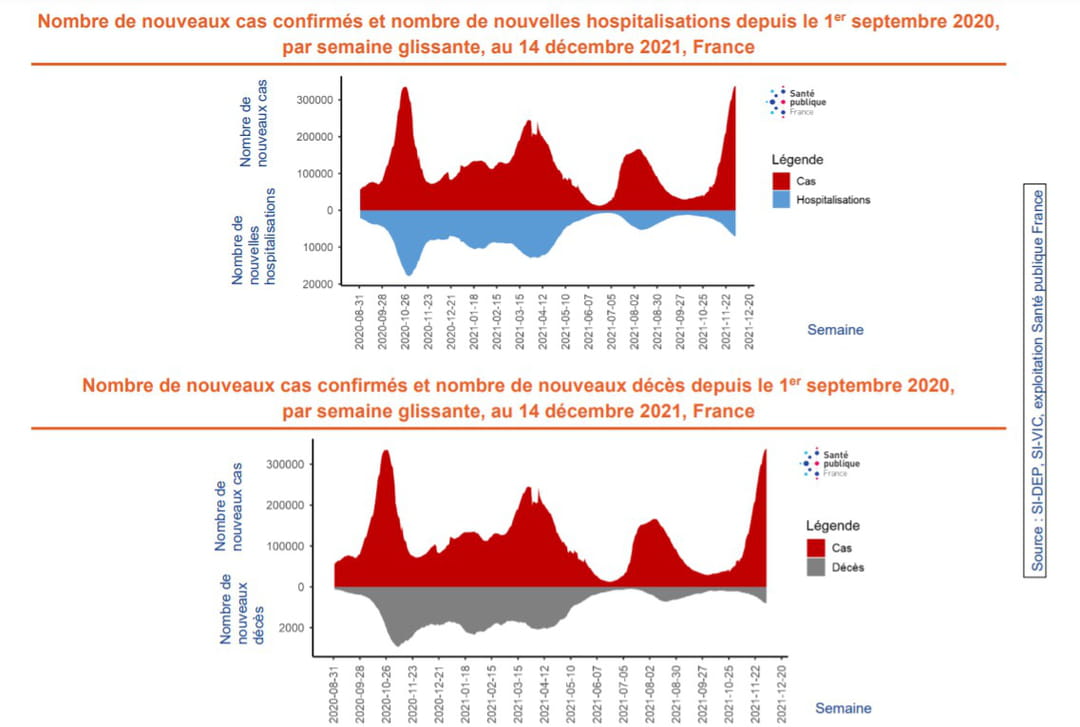
Since the first official cases recorded in France on January 24, 2020 by Public health France, the number of new cases and deaths of Covid-19 has increased increasing until the end of March. In other words, from the end of January to the end of March, France was in ascending phase. From April 3, 2020, the impact of the epidemic was major and “France was in a high plateau phase“indicated Jérôme Salomon, director general of health on April 10. The number of people hospitalized was the highest on April 14 (over 32,000) to gradually descend between April 20 and early June (around 15,000). Between June 15 and September 20, 2020, the number of hospitalized patients stabilized around 5,000 and the number of people in intensive care around 400: France was then in a low plateau phase. The numbers started to rise again at the end of August, leaving predict the start of a second wave.

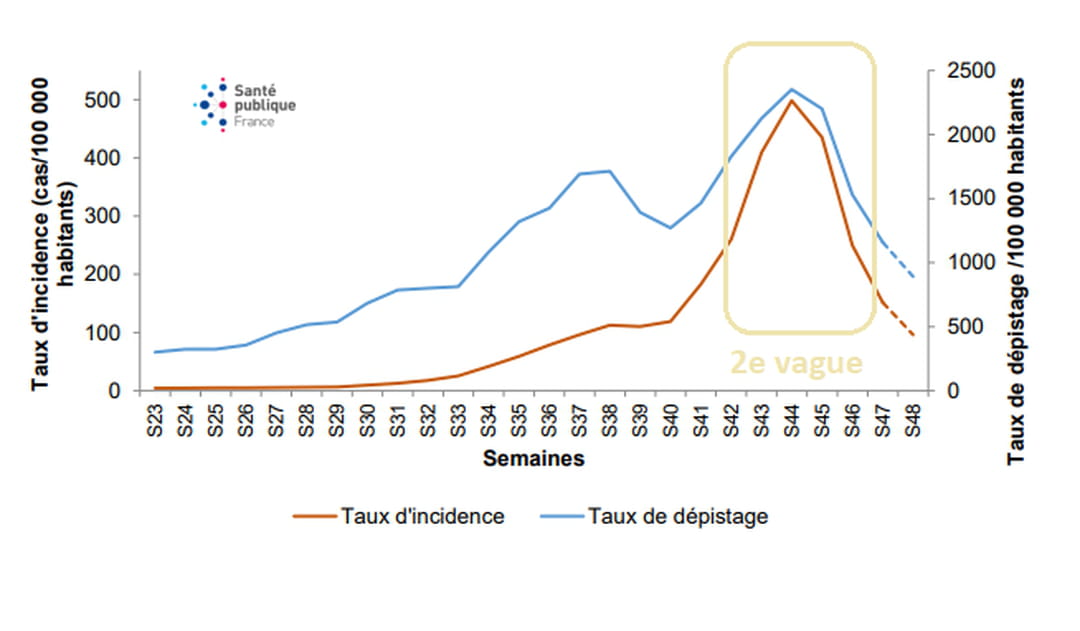
The Scientific Council alerted at the beginning of September 2020 of the occurrence at the end of that same month ofa second epidemic wave. “The circulation of the virus resumed during the summer of 2020 throughout France, especially among young adults. The number of cases diagnosed each day reached 10,000 on September 1“, he explained in a note October 26. A drop in the figures was observed during the second half of September (an average of 15,000 new infections per day). From October 1, 2020, “there is an extremely rapid increase in the number of new cases, which follows a general drop in temperatures (drop reaching 25 ° C for the maximums by place) which began between September 20 and 25 depending on the region“, continues the Scientific Council. The epidemic then progressed in France to reach in mid-November [autour du 15 novembre] a number of people hospitalized slightly higher than the peak in mid-April (around 32,000 people hospitalized each day between 11 and 20 November). In mid-November, the epidemic is in decline. On December 14, 2020, the daily number of new cases is around 4,000.
After experiencing a decline from November 16, 2020, the epidemic is started to rise again in mid-March 2021, with an average of new cases per day of 50,000. “Yes the third wave is here and it hits us hard “ warned the Prime Minister, Jean Castex, in front of the National Assembly on April 1, 2021. Monday March 29, 2021, the number of people in intensive care exceeded that of the peak of the second wave in the fall. This is the highest number since April 22, 2020. The health situation is particularly critical in Ile-de-France where hospitals are saturated. The highest number of critical care admissions was reached on April 12, 2021 with 495 new admissions.

On July 21, 2021, Prime Minister Jean Castex confirmed on TF1 that France had entered its fourth epidemic wave. At that date, the hospitalization curve was still low because we know that it takes on average 2 to 3 weeks for the increase in cases to have repercussions on the number of people hospitalized. The peak was reached in mid-August. The generalization of health pass pushed the French to go to get vaccinated which made it possible to lower the hospitalization curve.

|
The fifth wave of the COVID-19 epidemic started in early November 2021. The incidence rate increased sharply and exceeded the level reached in previous waves. “However, the hospital indicators are so far lower to those observed during waves 2 and 3, when vaccines were not yet available on a large scale, highlighted Public Health France December 16. However, it should be remembered that hospital tensions remain very present, with the deployment of the White Plan in several regions. Despite the increase in incidence observed in all age groups at the start of this 5th wave, the virus seems to have circulated mainly in the youngest. This wave, still conveyed by the 99% majority Delta variant, and also marked by the emergence of a new variant called Omicron. In this worrying context, the government is banking on recall campaign. “The high vaccination coverage in the general population and the progress of the booster campaign could significantly reduce the occurrence of severe cases, as well as the number of hospitalizations and deaths in all age groups. Moreover, the favorable impact of vaccination on the dynamics of the epidemic has already been demonstrated during the two previous waves (waves 3 and 4) “ argues the health agency. All adults are invited to receive a 3rd dose (or a 2nd if they have already been infected with Covid). Reminder that conditions access to the health pass on January 15, 2022.
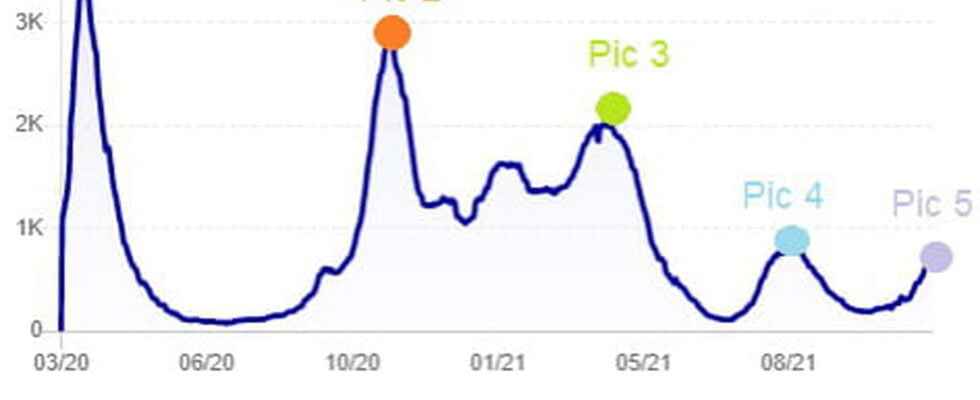
“Generally, new infections or new symptomatic cases are considered to define the crossing of the peak of the epidemic; in fact, they reflect the circulation of the virus in the population earlier than hospitalizations and deaths“, explains Public Health France in a press release dated November 26. We can therefore only determine the peak of an epidemic when it has passed. To decree the passage of a peak, epidemiologists rely on the observation of a clear decrease in indicators during at least two consecutive weeks. “However, the the passage of a peak does not mean the end of the epidemic wave, as many new cases continue to occur during the waning phase, insists the health agency“.
► Peak of the first wave : between April 6 and 10, 2020
► Peak of the second wave : between November 12 and 19, 2020
► Peak of the third wave : April 12, 2021 for hospitalizations and April 13 for resuscitation.
►Fourth wave peak : mid-August 2021.
► Peak of the fifth wave : estimated at the beginning of January 2022

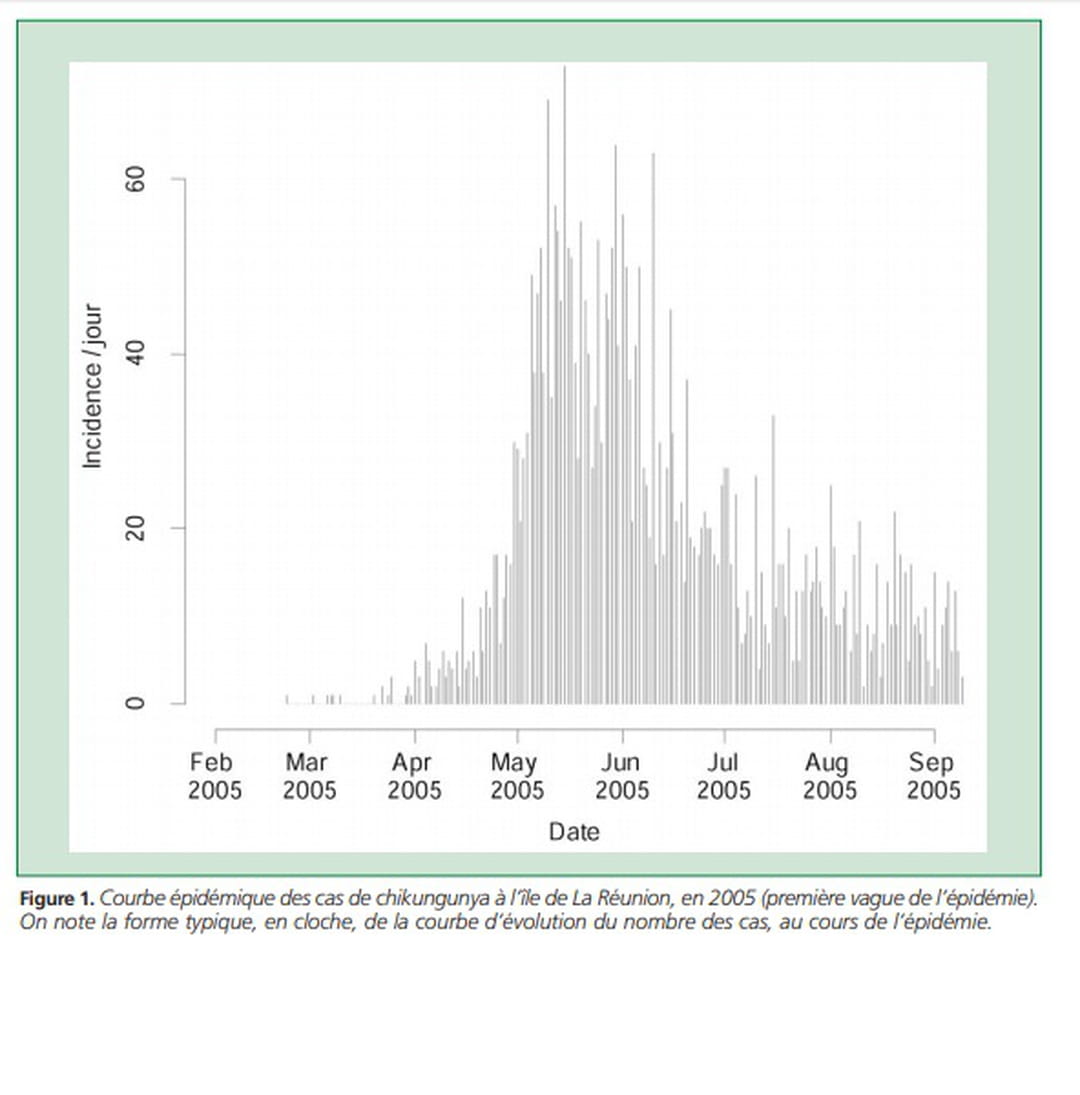
The bell shape (also called curve of Gauss in mathematics) is typical of evolution curves of a so-called “propagation” epidemic, as is the case with most diseases of human-to-human transmission (viral diseases). If we analyze the epidemic curve of a viral disease (see the curve below of the Chikungunya epidemic in 2005), we always notice an ascending phase at the start of the epidemic, then a bell shape that corresponds at the peak of the epidemic, a stagnation in the number of new cases and finally, a descending phase, where the number of cases gradually decreases. For some scientists, this typical “bell” shape represents an indicator that would announce that the peak of the epidemic has been reached and that the disease is in a very waning phase. For each of the waves, the epidemic curve seems to follow the bell curve (see curves above). For the moment, only the fact of developing collective immunity, by vaccination or natural antibodies, would make it possible to completely eliminate the epidemic.
Sources: Epidemiological point Covid-19, Public health France // Geodes curves – Public health France (hospital data) // Note from the Scientific Council Covid-19: a second wave leading to a critical health situation – October 26, 2020