Do you observe malfunctions, blockages or crashes on your PC? Use the Windows 10 Reliability Monitor to identify the causes.
Although overall more stable and robust than older versions, Windows 10 is not immune to malfunctions. Admittedly, the famous blue screens signaling a complete crash of the PC – and inducing a restart – are much rarer than in the past, but they have not entirely disappeared. And without going to this end, it happens that the computer blocks.
PC crashed: whose fault is it?
The problem in this kind of situation is that the origin of the problem is not always clear. And for good reason: between the multitude of Windows modules and services and the various applications that run in parallel on the PC, the interactions are numerous and it is often difficult to identify the combination or the action that has caused a malfunction.
Fortunately, since version 7, Windows has a tool to learn a little more: the Reliability Monitor. Hidden in the depths of the system, this little-known utility generates reports to analyze the events that have occurred on a PC, and in particular to identify incidents that have led to problems, including crashes.
However, beware: as valuable as it is, the Reliability Monitor has no repair function. As the name suggests, it is simply a control tool (monitoring, in English). It identifies the causes of problems and monitors the state of health of a PC using an index, which helps to make a diagnosis and anticipate possible failures. But it is by no means a cure.
Unlike other system tools, Reliability Monitor cannot be accessed directly through the Start menu or Settings – you have to go through the Control Panel and navigate through multiple windows. It is also all the more difficult to find that Microsoft does not use the same name everywhere, also calling it Reliability History… The easiest way to open it is still to go through the engine Windows search.
- Click on the search box in the taskbar and type Reliability history or simply
fiabilité
– in general, a few letters are enough – and click on Reliability history in the results area on the right.
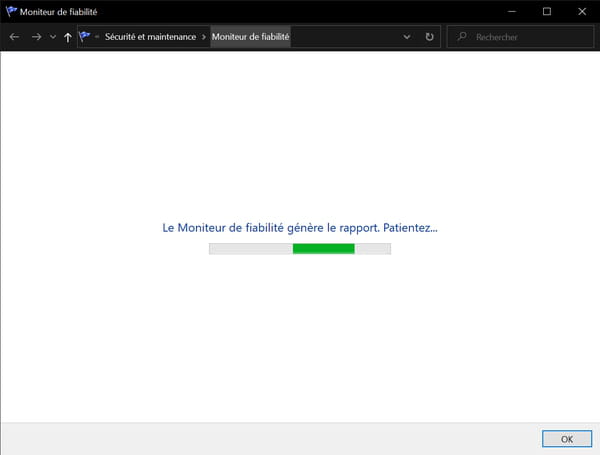
- A window titled Reliability Monitor – find the mistake ! – opens and the tool automatically starts an event analysis. Wait until the results are displayed.
Once its analysis is complete, the Reliability Monitor displays a graph with times (dates) on the abscissa and an index (an integer) on the ordinate summarizing the state of the PC and the events detected.
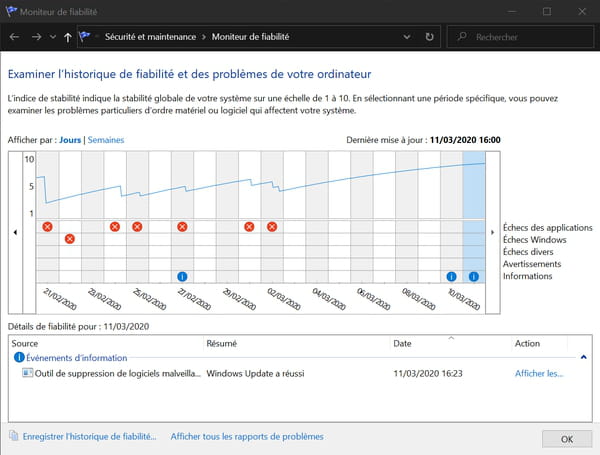
- The index indicates the overall stability of the system on a scale of 1 to 10. The higher it is, the more stable the PC.
- Beneath the index curve are lines reserved for various types of events.
The blue pellets only have an informative role: they correspond to various events, such as the installation of software or a Windows update.
The yellow triangles correspond to warnings.
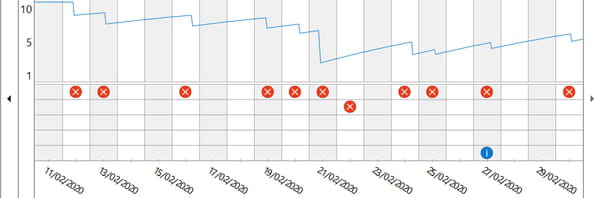
The red pellets correspond on the other hand to problems (so-called critical events). They are used to identify the cause of malfunctions.
- By default, Reliability Monitor displays only the last twenty days. Click on the arrows to the right and left of the curve to see other dates. Click on weeks, at the top, to switch to weeks view and go back further in time. Click on Days to return to the default view.
- Click on the strip corresponding to a day in the graph. The events that occurred that day are detailed below the graph, in the frame Reliability details.
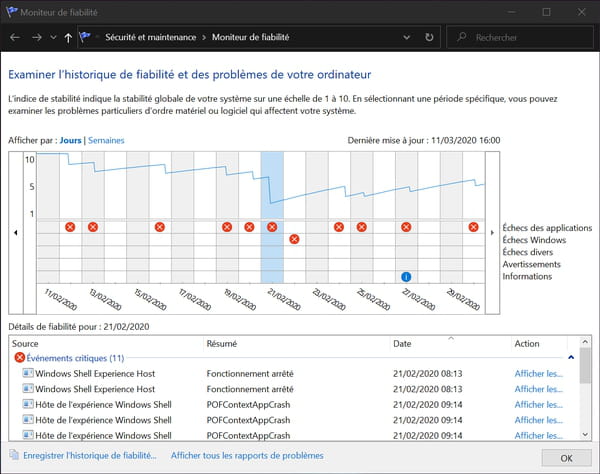
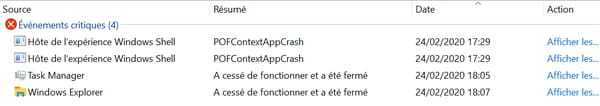
- Each event recorded is detailed on a line with the source (the name of the software or the module at the origin of the event), a summary (a short description of the event), its date and its hour. A simple visual examination thus makes it possible to locate the element at the origin of a problem.
- For more information on a particular event, click on the link Show technical details located in the column Stock or double-click directly on the line.
- The contents of the window change to display a full report on the selected event. There is a variable amount of miscellaneous information (name of the offending program, version numbers, etc.), some of which is very technical in nature and cannot be easily understood or used by ordinary mortals (event name, blocking signature, exception code, etc.). However, although cryptic, this information may be useful for providing details to a technical service or researching solutions on the Internet.
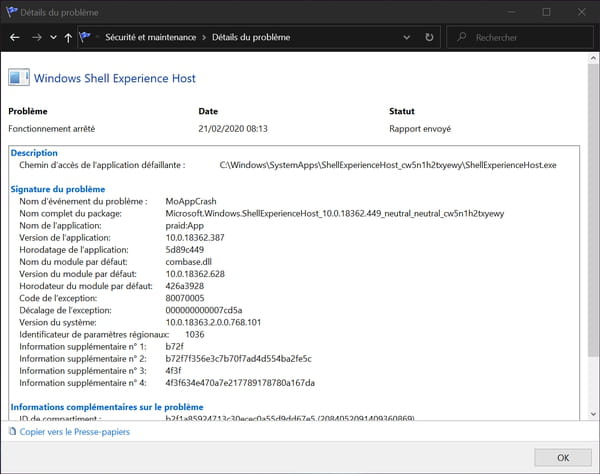
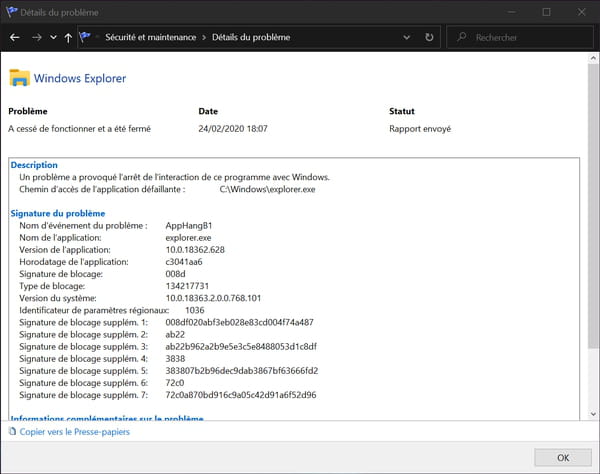
The most important information remains the name of the “offending” application, its exact version number and the path to its installation folder: practical details to replace, for example, a corrupted shared library (extension .dll), after downloading the sane original from the Net.
Again, the Reliability Monitor doesn’t solve anything: it just gives information about incidents. If you see the stability index going down and the crashes increasing, you should be able to identify the offending element – for example, a Windows program, driver or component, following an update – and possibly remove it or reinstall it properly. This diagnostic tool should be considered as a survey aid.
A crashing problem? Discuss it in our forums
- If you want to keep track of the report, click on the link Save reliability history. A dialog window opens, offering to save the report in a file in XML format.
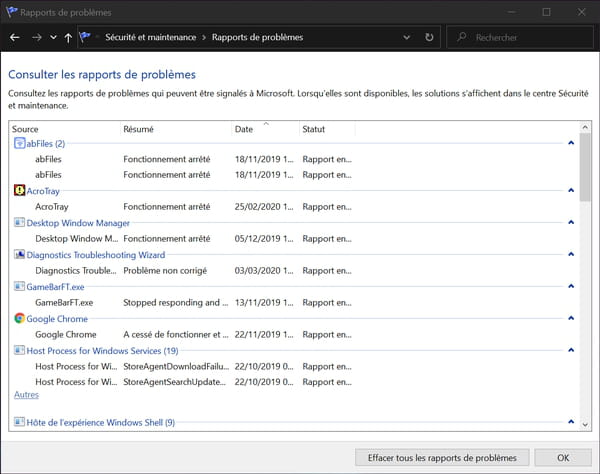
- If you are curious, click on the link View all problem reports. You will see the list of crash reports sent to Microsoft, without you even realizing it…