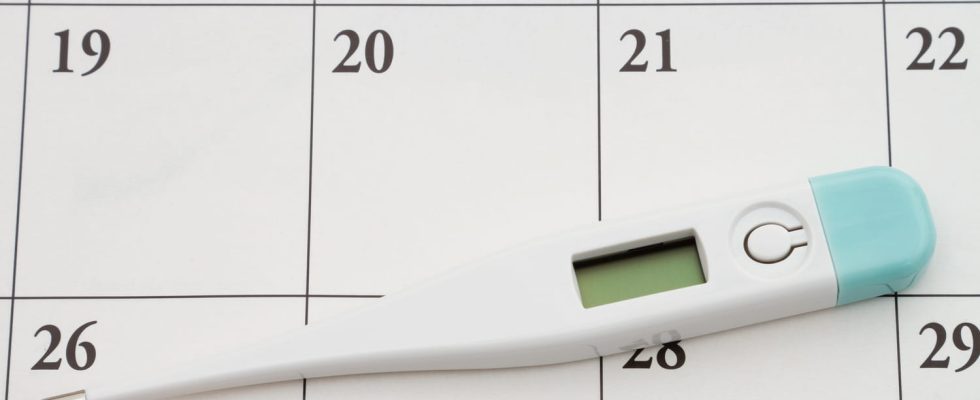
The temperature curve is a simple test to carry out to get an idea of your cycle and the date of ovulation. How to make your curve? How to use it to know if you are ovulating?
What is a temperature curve and what is it for?
A woman’s body temperature changes throughout the cycle.
- During a normal cycle, during the follicular phase, it is below 37°C and varies little.
- Just before ovulation, the temperature drops : it is at the lowest point of the cycle.
- Then, it rises again, above 37°C. It remains at this level for the duration of the luteal phase (12-14 days).
- In case of pregnancythe thermal plateau lasts beyond 28 days. On the other hand, if there has been no fertilization, the temperature drops to its normal level, just before the arrival of the period.
A temperature curve is especially useful to know the ovulation period, particularly in the event of irregular cycles or difficulty conceiving a child. An egg only lives for twelve to fifteen hours. Thus, sexual intercourse having taken place after the temperature has risen (i.e. 24 hours after ovulation) cannot a priori be fertile. The use of a temperature curve is particularly indicated when a couple is having difficulty conceiving a baby despite several months of unsuccessful regular sexual intercourse, but also during ovulation stimulation treatment. The temperature curve should never be considered as a means of contraception but as an aid to conception.
Simple to carry out, the temperature curve is a method consisting of take your temperature every morning, when you wake up and before getting up from the 1st day of the cycle (i.e. the 1st day of menstruation) until the 1st day of the next cycle allows you to determine the day of ovulation. It also gives information on the duration and regularity of the cycle. The temperature variations observed during a cycle are linked to variations in the level of progesterone.
- During the first part cycle temperature and progesterone are low. The temperature fluctuates between 36.1°C and 36.7°C.
- Ovulation arrives and the temperature passes the 37° markvs.
The method for monitoring your temperature must be the same throughout the duration of the monitoring and before each physical activity. It’s necessary note all symptoms observed : bleeding, pain, taking medication, sexual intercourse…
What is a normal temperature curve?
The temperature changes observed during a cycle are related to variations in progesterone levels during this cycle. During the first part of the cycle the progesterone level and the temperature are low. There is a drop just before ovulation, then the temperature rises and remains more or less stable until the next period. After menstruation, the progesterone level drops as well as the temperature. Monitoring should be carried out at least during 2 consecutive cycles, but it is recommended to carry out this approach for 3 cycles.
Photo of an ovulation curve
With ovulation: A temperature curve includes two distinct plateaus separated by 3 or 4 tenths of a degree to a half degree (a low temperature until ovulation then higher afterward). Ovulation occurs the day before a rise in temperature.
Without ovulation : Any abnormality in the curve may indicate an ovulation disorder and should lead to a hormonal assessment, especially in the context of infertility.

