Tag: INFOGRAPHICS
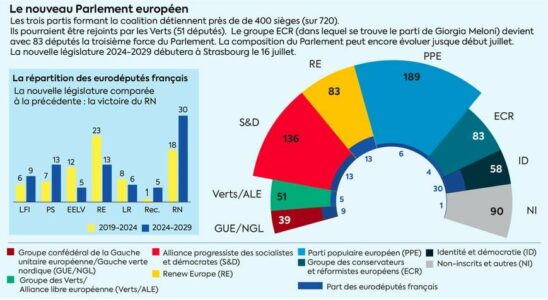
Three infographics to understand the new balances in the European Parliament – L’Express
This is the new face of Europe following the June 9 elections in the 27 states of the European Union: more right-wing governance, marked by the victory of the European…
understand everything in three infographics – L’Express
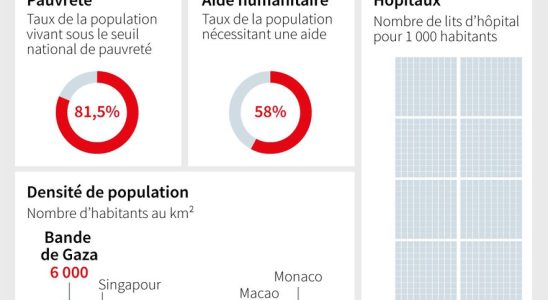
Are we heading towards a humanitarian catastrophe? Israel on Friday ordered the evacuation within 24 hours to the south of “all civilians” from Gaza City, a measure condemned by the…
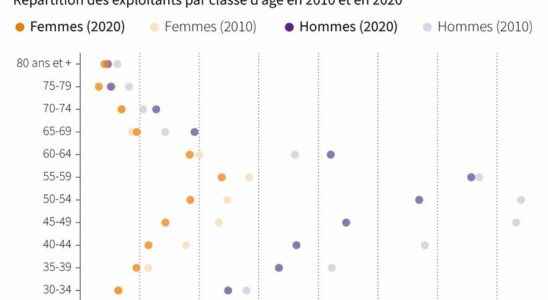
Fewer, older… French farmers in three infographics
While the new edition of the Agricultural Show begins this Saturday, February 25, in a context of inflation marked by the war in Ukraine, the last census of the agricultural…
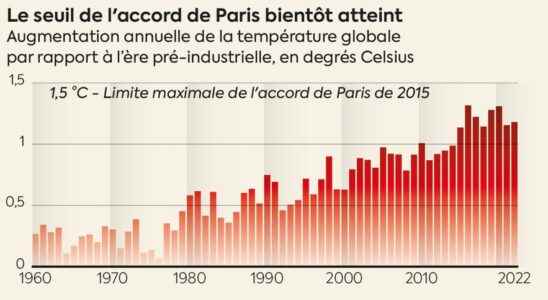
Climate: 2022, the year of all records in five infographics
The records follow one another, and look alike. On the planet, carbon dioxide emissions continue to increase, contributing to global warming. In mid-January, the World Meteorological Organization confirmed it: the…
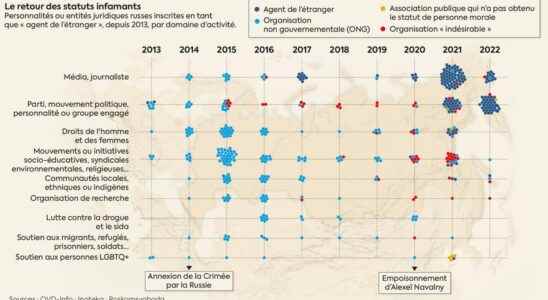
Putin, ten years of fierce repression in Russia in four infographics
The repression of Putin’s opponents is not new, but it has intensified with the war in Ukraine, pushing many Russians to go into exile. Opponents of the conflict who have…
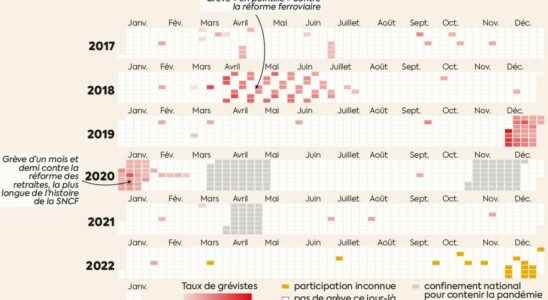
Strikes at the SNCF in five infographics
Thursday, January 19, France is preparing to experience a new day of social mobilization, in opposition to the pension bill. Among the professions on the front line, SNCF employees will…
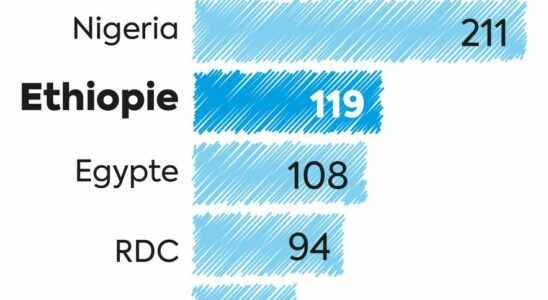
Ethiopia, a giant on borrowed time: four infographics to understand the situation
“Giant of East Africa”, “water tower of Africa” or even “power of tomorrow”… The laudatory adjectives have multiplied in recent years when designating Ethiopia. The second most populous country on…
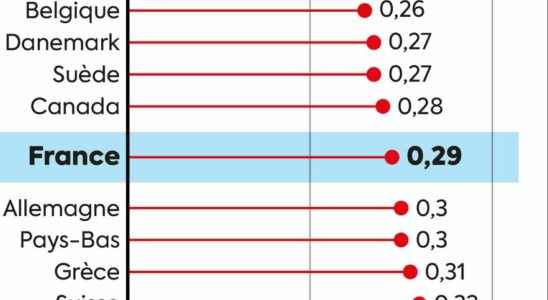
Inequalities in France: three infographics to understand the strength of our social model
“I think that democratic peoples have a natural taste for freedom; left to their own devices, they seek it, they love it, and they see only with pain that they…
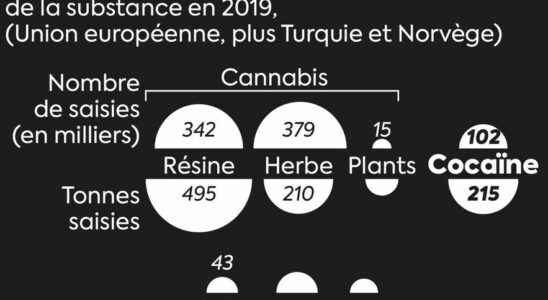
Cocaine: four infographics on a European scourge
The case caused a stir: 49 suspects arrested, 30 tons seized, several countries and police involved. The Europol operation which revealed a “super-cartel” in November puts drug trafficking on the…
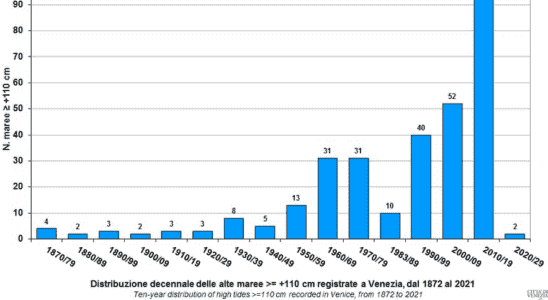
Venice finally saved from the waters? The Mose project explained in four infographics
What if it was the right one? The mythical city of Venice was born centuries ago in the heart of a fragile ecosystem, its lagoon. Depending on the weather and…