You will also be interested
[EN VIDÉO] Take advantage of new technologies for agriculture “Smart farming” or precision agriculture is developing in Europe to enable farmers to produce better and thus increase their income. Farms are modernizing through the use of new technologies, what will they look like in the future?
How much the pesticides are they present in your city? It is to answer this question that the Toulouse-based associative company Solagro has made available to all a interactive map who has ” for ambition to bring to the knowledge of all the municipal data on the use of pesticides. »
To consult the level of pesticide use throughout France, or more specifically in a given city, simply log on to the dedicated page of the site and type in the name of your municipality. Each colorfrom green to scarlet red, makes it possible to visualize the‘phytosanitary treatment frequency index (IFT).
It’s about a ” estimate of the level of pesticide use for each French municipality on the basis of the rotation of the municipality, the type of practice (conventional or organic) and the regional reference TFIs derived from statistical or local data. It provides information on the average level of pesticide use in agriculture at the scale of a municipality and can be broken down by type of product: herbicidesexcluding herbicides (insecticides, fungicidesseed treatments and other treatments), biocontrol products. »
The value obtained for each city corresponds to “ a reference value to which the farmers of the municipality can compare their IFT exploitation, but also a value representing the risk of water pollution,air and food related to the use of pesticides in farming. This card takes its name from a messicole plant, theAdonisa species icon threatened by the widespread use of herbicides.
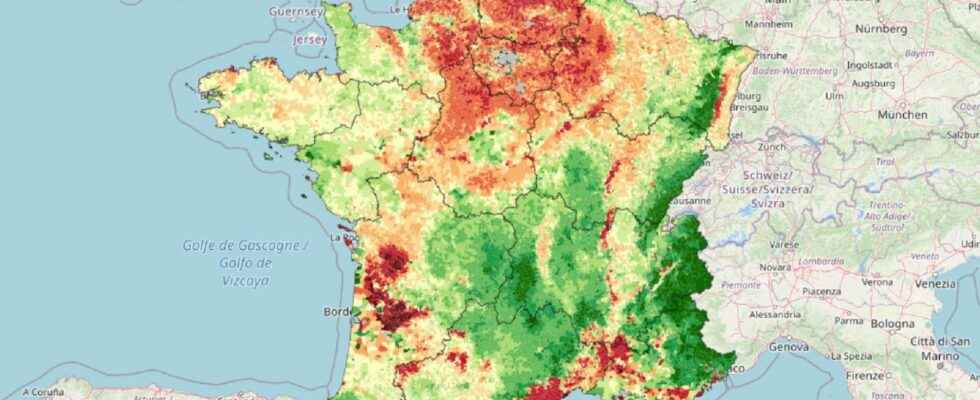
Mountains, coasts and groves are the least treated areas
The map of France highlights territories that are highly protected with respect to the use of pesticides: those located mainly in mountain areas, coastal marshes, and a strong presence of grassy areas for livestock that are generally not treated. Conversely, it is easy to spot the specialized agricultural areas of the Grand Bassin Parisien, the Garonne valley, the Rhône corridor, Limagne, the wine-growing areas and arborealwhether in viticulture, fruit growing or field crops, heavily treated with pesticides.
Among these major disparities, the areas using the least pesticides:
- the department of Drôme with 23% ofOrganic Agriculture with an IFT of 2.4;
- the Gers department with 22% organic farming and an IFT of 2.4;
- the Manche department, which has managed to preserve its grassland farming and its bocage with an IFT of 1.41 and 8% organic surface area.
Conversely, the areas most treated with pesticides are often located in the north of the country:
- the Somme department with an IFT of 6.88 and 2% organic surface area;
- the department of Aisne with an IFT of 4.8 and 2% organic surface area;
- the department of Eure et Loire with an IFT of 4.89 and 3% organic surface area.
Solagro specifies that the apple remains most treated crop, followed by peach, potato and vine. Among the least treated crops, soythe cane sugar or even the sunflower.
Behind this map and these public data accessible free of charge, the idea is to encourage people to turn to sustainable agriculture, respectful of natural resources, climate and of the health of the French.
Oogst 1000, a farm of the future that will also be a hotel and restaurant The Oogst 1000 Wonderland would consist of a farm, a restaurant, a hotel and an amusement park, all operating in total self-sufficiency. Oogst means “harvest” in Dutch. This installation would be designed to receive 1,000 people per day, which explains the name of the project. All rights reserved. http://www.tjep.com/studio/works/architecture/oogst-1000
Oogst 1000, an educational farm that looks like an amusement park All the industrial processes used in the installation will be visible to the general public. He can also use the cable car made available to him to visit the site. Oogst 1000 would therefore correspond to a very good tool for raising awareness of the economic and ecological issues encountered in agriculture. All rights reserved. http://www.tjep.com/studio/works/architecture/oogst-1000
The Oogst 1000 farm relies on direct sales from producer to consumer Oogst 1000 could house crops in greenhouses, but also livestock. Cows would thus be raised high up on fields located near the milking parlor (bottom left). Milk and its by-products (butter, yogurt, etc.) would therefore be produced on site and served in the site restaurant. No need to make them travel long distances. The water supply could be provided by boreholes drilled underground or by surface pumping. All rights reserved http://www.tjep.com/studio/works/architecture/oogst-1000
Oogst 1000, a participatory and free farm The hotel and restaurant are located in the center of this futuristic farm. They could accommodate people for free, but on one condition: the public must participate in the life of the structure. Visitors would somehow eat and drink the fruits of their labor. Another typically Dutch-inspired detail, the white walls painted with blue decorations refer to Delft earthenware. All rights reserved http://www.tjep.com/studio/works/architecture/oogst-1000
The farm of the future Oogst 1000 relies on renewable energies This farm of the future was designed by a firm of Dutch designers. The presence of the windmill at the top of the building and the shape of the houses (or structures supporting crops) can testify to this. This architecture hides innovative agricultural processes not found in classic Dutch farms. Everything has been done to make this facility as green as possible: installation of a wind turbine, solar panels, waste recycling, air purification by plants, etc. All rights reserved. http://www.tjep.com/studio/works/architecture/oogst-1000
The energy autonomy of Oogst 1000, the farm of tomorrow The central body of the farm would house facilities for the production of meat, for example from pigs raised on site. The organic waste generated by these animals, like that produced by humans going to the toilet, could also be used for the production of biogas. The system is also intended to be autonomous from an energy point of view. All rights reserved. http://www.tjep.com/studio/works/architecture/oogst-1
Oogst 1, a farm with a low ecological footprint This detached house could be installed anywhere, for example at sea or on the roof of an office building. It rests on the ground at three points, which would reduce its footprint on the environment. The installation displays a cross shape. The house is only a small part of it. The rest consists of greenhouses, storage rooms and recycling facilities. Only one animal species could be raised inside: the hen. These organizations would provide eggs and, where appropriate, meat. All rights reserved. http://www.tjep.com/studio/works/architecture/oogst-1
Oogst 1, an individual farm that promotes waste recycling This house is meant to be truly sustainable. It would therefore integrate all the tools necessary to recycle or make the most of the waste produced. All rights reserved http://www.tjep.com/studio/works/architecture/oogst-1
The miniature farm Oogst 1, an independent dwelling The Oogst 1 Solo project is much more modest than its counterpart Oogst 1000. It is a house that can shelter a person while providing him with food, heating or powering his electrical appliances. This house is intended to be comfortable since it consists of a living room, a kitchen and a bathroom on the ground floor. A bedroom completes the whole upstairs. All rights reserved. http://www.tjep.com/studio/works/architecture/oogst-1
The Oogst 1 farm, a real ecological house This ecological house would be supplied with electricity by the windmill overhanging the house and by the solar panels present on the roof of the greenhouse. The use of two power sources makes it possible not to be dependent on a particular factor (wind or sun, for example). A large part of the CO2 possibly produced by the house could be absorbed by the plants populating the greenhouses. These plants would therefore play a role of air purifier. All rights reserved. http://www.tjep.com/studio/works/architecture/oogst-1
Interested in what you just read?