The measurements of individual exposure to pollution, which are generally taken at the place of residence, ignore two major parameters: the much greater exposure during journeys and the variations in air volumes, and consequently in the quantity of airborne pollutants, inhaled according to the physical activity of people during their travels.
the carbon soot is considered one of the best road traffic markers. It is generated in particular by the combustion incomplete fuels fossils and others molecules produced by traffic. Previous studies have shown that exposure to carbon soot can cause chronic respiratory disease, neurological damage and cardiovascular disease.
In general, individual exposure to airborne pollutants is defined by the amount of these pollutants in theair estimated or measured at the place of residence. However, this method ignores the significant variations in exposure related to travel and activities. However, these are responsible for a significant part of daily exposure to airborne pollutants.
A number of epidemiological studies have suggested that users of motorized vehicles (private or public transport) are more exposed to air pollution than users of so-called “active” transport, even if cyclists ride near the road traffic. However, these studies do not take into account the role of ventilation minute (debit corresponding to the lung volume mobilized in one minute by breathing) which is specific to each individual and varies very widely depending on the activity carried out during the activities, and which therefore has an effect on the dose of pollutants inhaled by each individual.
How did the researchers proceed?
Doctoral student Sanjeev Bista and Inserm research director Basile Chaix, at the Pierre Louis Institute of Epidemiology and Public Health (Inserm, Sorbonne University), therefore sought to quantify carbon concentrations soot to which users of different types of transport are exposed and the quantities of this air pollutant inhaled during their daily journeys. The data was collected in the Grand Paris metropolis between 2018 and 2020 as part of the MobiliSense study funded by the European Research Council. Their work is published in Environment International.
The team followed 283 participants for 6 days each. During their journeys (locations collected by GPS) and between two journeys (when they were at their place of residence or at work for example), a sensor worn slung over the shoulder by each participant made it possible to measure the aerial concentration of soot carbon at the level of their breathing zone (near the nose and mouth). The journeys have been segmented according to the different modes of transport used during a trip; in the end, almost 7,500 travel segments were analyzed. Taking into account the minute ventilation of each person in each travel segment (estimated using a accelerometer measuring activity physical), the dose of soot carbon inhaled by the participants during each journey could thus be quantified.
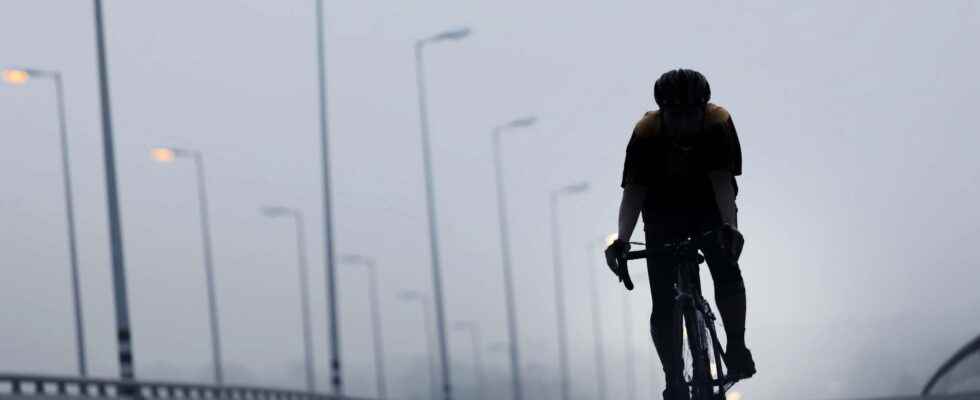
Twice as much soot carbon inhaled for cyclists and pedestrians
The results of the analyzes show that for the same period of 30 minutes, the participants when they move inhale more than 2 times the dose of soot carbon that they inhale when they are at a place (residence, work, other).
Furthermore, so-called “active” modes of transport are associated with a lower average soot carbon concentration in the breathing zone than motorized transport (with an even lower exposure for walking than for cycling). Compared to walking, this represents +2.20 μg of soot carbon per m3 of air on average in public transport with a maximum of +3.08 μg/m3 in the metro – almost twice as much as during active transport – and +2.29 μg/m3 in private motorized vehicles.
However, the ranking of modes with respect to exposure is largely reversed when considering the dose actually inhaled instead of the concentration measured in the breathing zone. Cycling is associated with the highest soot carbon inhalation (+0.41 µg for 30 minutes of travel compared to walking), whereas other modes of public transport (except the metro however ) involve less soot carbon inhalation (for example -0.94 µg for the tramway for a 30-minute journey compared to walking). Similarly, the use of a private motorized vehicle is associated with less soot carbon inhalation, while this mode is associated with a higher concentration compared to walking.
Why are pedestrians and cyclists more affected?
Thus, although less exposed in terms of soot carbon concentrations than users of motorized transport, pedestrians and cyclists inhale more of this pollutant for an equivalent journey time.
“The fact that the amount of soot carbon inhaled is greater in active modes of transport when the user is exposed to a lower airborne concentration than a user of motorized transport is explained by a much greater minute ventilation when the ‘we use active transport’, says Basile Chaix. Indeed, the volume of air absorbed increases with the intensity of physical activity. Variations in the latter from one mode of transport to another therefore have a decisive impact on the quantity of pollutants inhaled. Thus, if cyclists inhale more soot carbon, it is because cycling combines greater physical activity and proximity to road traffic than walking.
“However, it is important to clarify that the inhalation of air pollutants is only one element of the picture of benefits and risks associated with the different modes of transport, and that the other pieces of the puzzle which are the exposure to noise, stress in transport and the physical activity carried out, for which the practice of walking and cycling is widely recommended” concludes the researcher. Future studies by the team will explore the physiological response of study participants, in terms of arterial pressure and lung function, air pollutants in transport microenvironments.
—
Discover Thread of Science! Every Friday, from 6:30 p.m., follow the summary of the week’s scientific news, deciphered for you by Futura journalists.
—
Interested in what you just read?
.
fs6