A sensor installed on the ISS allows NASA to have a global map of lightning strikes across the globe from 1995 to 2020. It highlights the most struck areas in the world and offers insight into the effects of climate change.
Dozens oflightning occur every second around the world, each lasting an average of 30 microseconds. Even though the exact formation of the phenomenon still remains mysterious, the satellites have made it possible to better understand the distribution of lightning on Earth since the 1990s.
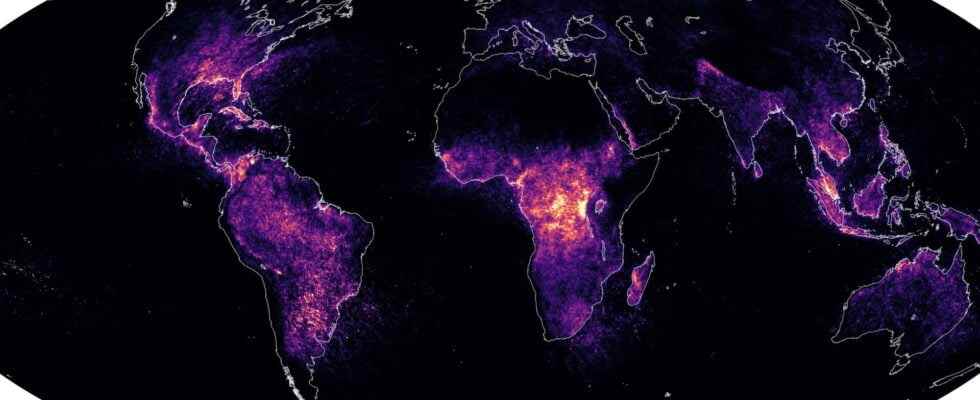
All the lightnings of the Planet gathered on a map
The very first map of the distribution of lightning on Earth was published in 2001 thanks to the Orbview-1 satellites and Nasa TRMM. Twenty years later, the same sensor READ (Lightning Image Sensor) improved is now used on the international space station (ISS) to map lightning over the long term, over several decades. Combined with several other sensors, including the OTD (Optical Transient Detector), data from the international space station have made it possible to achieve a lightning card in the world from 1995 to 2020.
The novelty in this map is that it covers the entire globe, including the areas located very far north (Canada) or very far south (Patagonia) while the previous ones lacked data on these areas and only covered with precision the tropics, and more wave the tall ones latitudes.
Another improvement, all lightning is taken into account, not only those that hit the ground, but also horizontal or intra-cloud lightning that remains in the sky. The data also highlighted the existence of “megaflashes”, those flashes that travel over incredible distances, sometimes several hundred kilometers: the longest of them covered a distance of 709 kilometers across the skies of Argentina and Brazil in 11 seconds in 2018. Another, around 500 km across Argentina, lasted 16 seconds.
The hottest areas in the world
Satellite data made it possible to highlight light the hottest areas in the world : Venezuela in South America, Rwanda and Congo in Africa. Located in the north of Venezuela, Lake Maracaibo is unquestionably the area with the most lightning strikes in the world, with an average of 389 lightning strikes per day!
It would be enough to use the energy of 10 minutes of lightning from Lake Maracaibo to be able to supply electricity to all of South America
There can be up to 28 flashes per minute during the nine hours of night during the high season thunderstorms in September and October. The electric potential is so powerful that it would suffice to use theenergy of 10 minutes of lightning from Lake Maracaibo to be able to supply electricity to all of South America.
Second area with the highest density of lightning in the world, Lake Kivu, on the border between Rwanda and the Democratic Republic of Congo, with an average of 368 lightning strikes per day.
Understanding the link between lightning and climate change
Among the future apps from these satellite sensors, the researchers hope to have a better understanding of the impacts of climate change on the evolution of the number of flashes. But also, understanding how lightning itself affects the global warming ! Surprising as it may seem, lightning also contributes to climate change, by producing carbon dioxidenitrogen, a greenhouse gas.
Until now, scientists thought that emissions of greenhouse gases from lightning represented only 10% of total emissions, but this percentage could be revised upwards. NASA is currently conducting several studies to calculate the total amount of pollution emitted each year by lightning and thus estimate its real impact on climate change.
Interested in what you just read?
.
fs11