Methane is the second greenhouse gas with a release of 97 million metric tons per year. To follow the evolution of its emissions, scientists have established maps from the observations in situ. Compared to satellite data, they provide new information.
You will also be interested
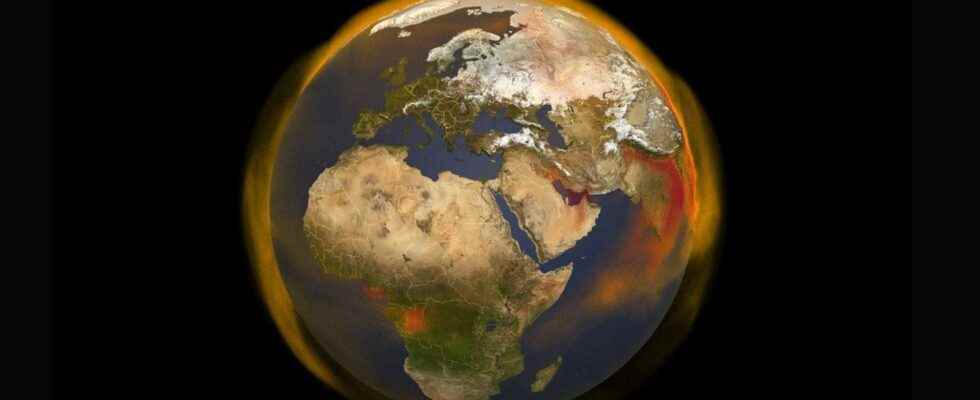
[EN VIDÉO] Visualization of methane emissions on the planet In video: methane emissions by regions of the globe and by sources as well as an estimate of the weight of emissions by latitude.
the methane (CH₄) is a gaseous chemical compound and is the second anthropogenic greenhouse gas after carbon dioxide (CO2). Since the Industrial Revolution in 1750, methane has been responsible for 20% of the greenhouse effect produced in the bass atmosphere and is 30 times more powerful than CO2 on the scale of 100 years to trap the infrared radiation emitted by the Earth. Its sources ofemissions are varied (biogenic, thermogenic and pyrogenic emissions) but a large part of the global emissions come from the exploitation of fossil fuels : the extraction, storage and transport of oil, from natural gas and coal.
According to the United Nations (UN), these emissions release about 97 million metric tons of methane per year. According to United Nations Framework Convention on Climate Change (UNFCCC), individual countries must report their methane emissions by sector (oil, gas, coal) but most only provide one figure per sector for the whole country.
Maps for more precision
However, these estimates made by the countries are not of the highest precision. Thereby a NASA-funded program has enabled scientists to draw new maps detailing the geography of methane emissions from the production of fuels fossil fuels within countries, before the fuels are consumed.
These maps are based on the location of mines in coal, oil and gas wells, fuel storage and transportation infrastructure, such as pipelines, and refineries. The data used are those of the 2016 emissions which are the latest complete data available to the public. They provide a representation of the spatial distribution of methane emissions and thus help to tell scientists where most emissions are and where to monitor changes in greenhouse gas emissions.
According to the maps obtained, the main sources of coal-related emissions seem to depend on where it is extracted, while the sources for emissions from oil and gas are distributed between wells, flares, pipelines, refineries and storage facilities. In addition, they indicate that the main sources of oil-related methane are in Russia, and those from natural gas emissions are in the United States. We also note that most of the emissions are not distributed along the pipelines which are the pipelines which are used for transport, but above all come from compressor stations which compress the gas and keep it in movement.
Comparison with satellite data
By comparing these new maps with the observations of the greenhouse gas observation satellite (GOSAT) of the Japanese Aerospace Exploration Agency and the Tropospheric Monitoring Instrument (TROPOMI) aboard the European Space Agency’s Copernicus Sentinel-5 Precursor satellite, Scarpelli’s colleagues at Harvard observed differences.
The first finding is that methane emissions from fossil fuels are globally underestimated in Canada and the United States. Next, they observed that methane emissions from coal in China, oil and gas in Russia are overestimated, which can be explained by a lack of observation. in situ and a lack of precision on the location of their infrastructures. Indeed, Scarpelli and his colleagues worked unspecified locations of compressor stations or pipelines for Russia. They were forced to scan a paper map from the Harvard University library in order to map pipelines and be able to break down methane emissions based on their location.
Satellite data complement measurements well in situ which are scattered on Earth, and therefore allow for more planetary coverage. In addition, monitoring the evolution of anthropogenic sources is essential to establish relevant emission scenarios in anticipation of the weather future.
Interested in what you just read?