Half a million Covid-19 contaminations in just one day: this is the impressive figure noted by the various laboratories on Tuesday in France. A record, that goes without saying. The previous one dated from a whole week ago, with 464,769 new positive cases for the virus detected. We reassure ourselves as we can: the progression, ultimately, is “only” 8% over seven days. The daily average (sliding), on this indicator, reached on January 26 just over 366,000 cases (+ 1.46%).
“The number of new contaminations no longer has the same value as with the previous variants”, recalled Tuesday on France info the president of the Scientific Council, Professor Jean-François Delfraissy. Their number will “slowly end up decreasing, with heterogeneity depending on the region”, according to him. The concern is more about hospitalizations. The pressure on health establishments could be very strong, at least until “mid-March”, continued the scientist.
Currently, the figures show a rather counter-intuitive dynamic: hospitalizations are increasing, but the number of people currently admitted to critical care units is decreasing. However, this difference can be explained.
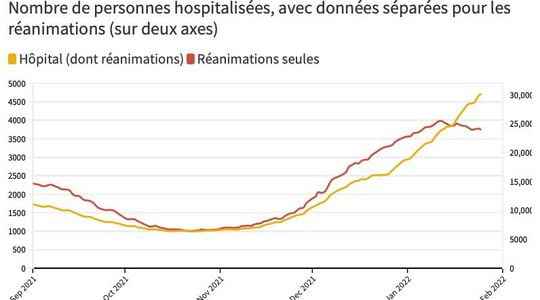
In the hospital, the gap is widening between conventional care and resuscitation
Stack: the number of hospitalizations due to Covid-19 rose above 30,000 for the first time since the end of 2020, on Tuesday, with 3,842 new admissions in 24 hours (+ 9% compared to the previous week). Face: the number of intensive care patients fell slightly, to 3,741 against 3,852 a week earlier (-2.88%).
How to interpret it? Overall, you should know that Omicron, despite its high contagiousness, causes shorter hospital stays than Delta (a reduction of 10 to 30% according to the DREES) and fewer intensive care admissions, the Paris hospitals also said, a fortnight ago, after a month of observation.
A particularity confirmed, here again, by the DREES: despite 95% of new cases detected attributable to Omicron between January 10 and 16, the variant was only responsible for 73% of admissions to conventional hospitalization, and 54% of those in intensive care units. On this last key indicator, entries are therefore less and less frequent, as shown in the graph below.
But the fifth Delta-Omicron wave is continuing its journey: one in ten French people has tested positive since January 1. In fact, hospitalizations “for” and especially “with” Covid are increasing. As a reminder: the figure for hospitalizations includes patients admitted due to Covid contamination, and those who suffer from another pathology, but who are still positive for the virus.
In his weekly newsletter published last Thursday, Public Health France thus noted that at the hospital, “the proportion of patients admitted to the hospital for a reason other than Covid-19 (but carriers of SARS-CoV-2) was increasing: 26 % in week 2 vs. 21% in week 1 for all-department hospitalizations, a bias that is not surprising, given the record number of contaminations in France.
Can we say that the figures for hospitalizations are overestimated? As reminded Release, this share of patients “with” Covid has always existed. It fluctuated between 9 and 20% between March and July 2021, and averaged 13% over the past year. Double today, then.
These data can partly reassure on the continuation of the epidemic in France. But be careful not to let your guard down. However, hospitals recorded 364 deaths from Covid-19 in 24 hours (+132 compared to the previous week), bringing the total death toll in France to 129,489 since the start of the epidemic.