unsaveSave
expand-left
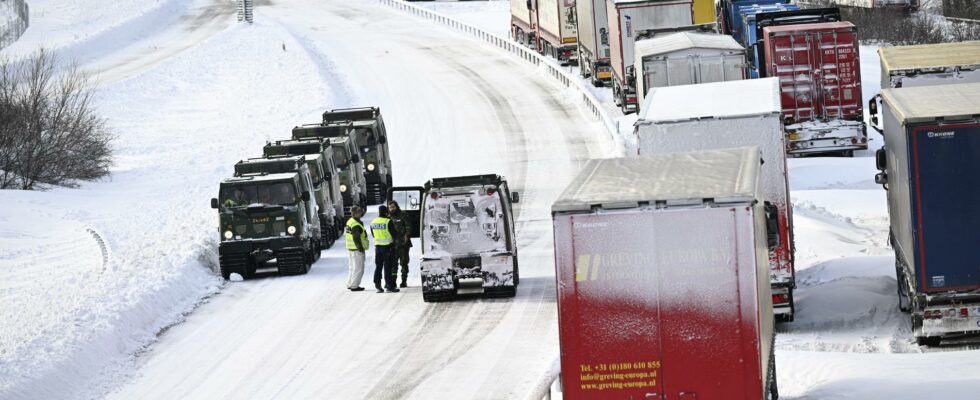
full screen Trucks stuck in the snow on the E22 near Linderöd in Scania in October. Stock photo. Photo: Johan Nilsson/TT
Sweden is among the countries in the EU that carry out the least number of vehicle inspections of road transport.
Embarrassing, says EU Member of Parliament Johan Danielsson (S).
According to statistics from the European Commission, Sweden lands just above the EU’s minimum requirements in terms of the number of checks on the transport vehicles concerned. Only five countries are worse: Lithuania, Cyprus, Slovenia, Hungary, Ireland and Malta.
Nothing further at all, Danielsson thinks, especially considering the prevailing winter weather.
– We will have tens of thousands of trucks driving with substandard and, in the worst case, no winter tires at all. Then it is clear that it is a huge problem that Sweden has decided to be the worst in the class, says Danielsson, who sits on the EU Parliament’s transport committee.
He urges the government to act so that Sweden at least comes up to Finland’s level. Finland is at 5.6 percent of checks made per the number of working days for the vehicles. This is clearly above the EU average of 4.7 percent and well above Sweden’s level of 3.1. The minimum level is 3 percent.
– Here in the EU, we must make sure to raise this minimum level so that all countries are forced to have more road checks, but Sweden must have higher ambitions themselves. It is important for traffic safety, but also for law and order and healthy competition, says Johan Danielsson.
FACT Roadside checks in the EU
A report from the European Commission from September compares how many checks the member states make of transport vehicles along the roads and in other places. This is what the list looks like for the years 2021–22, calculated in the number of checks per estimated number of working days for the vehicles:
1) Romania: 21.3 percent
2) Portugal: 8.4
3) Austria and Bulgaria: 7.7
5) Germany: 6.5
6) Latvia: 5.9
7) Finland: 5.6
8) Spain: 5
9) Croatia: 4.7
10) Czech Republic: 4.6
11) Luxembourg: 4.2
12) Estonia and the Netherlands: 4.1
14) France and Poland: 3.8
16) Denmark: 3.6
17) Slovakia: 3.4
18) Greece and Italy: 3.2
20) Belgium and Sweden: 3.1
22) Lithuania: 2.7
23) Cyprus and Slovenia: 2.4
25) Hungary: 1.9
26) Ireland: 0.7
27) Malta: 0.5
EU total: 4.7
Source: EU Commission
Read more
