FRANCE COVID SITUATION. The incidence rate of Covid is on the rise in all regions of France, especially in Île-de-France, Brittany and Occitanie. What is the situation by department? For hospitalizations? In Europe ? In the world ? For traveling ? Which countries are in the red zone?
[Mis à jour le 6 juillet 2022 à 12h27] The Covid-19 epidemic has started well in France. On June 30, Public Health France confirms in epidemiological point that the incidence rate is rising sharply in all regions, from +46% in the Grand Est to +73% and in Provence-Alpes-Côte d’Azur. The the highest rates are observed in Île-de-France (968, +50%), in Brittany (779, +61%) and in Occitania (773, +64%). The positivity rate is particularly up sharply in Provence-Alpes-Côte d’Azur, Corsica and Brittany. The highest hospitalization rates are observed in Corsica, Provence-Alpes-Côte d’Azur and Bourgogne France-Comté. What is the Covid situation in each department or region of France? For trips this summer ? In Europe ? In the world ? What are the red areas ? here are the pictures published by Public Health France (and his website Geodes), the Ministry of Health and the Directorate-General for Health and the European Center for Disease Prevention and Control (ECDC) for the epidemic in Europe.
Map of countries for traveling
The map of countries classified by color according to their epidemic situation and published by the government has not changed since March 31, 2022.
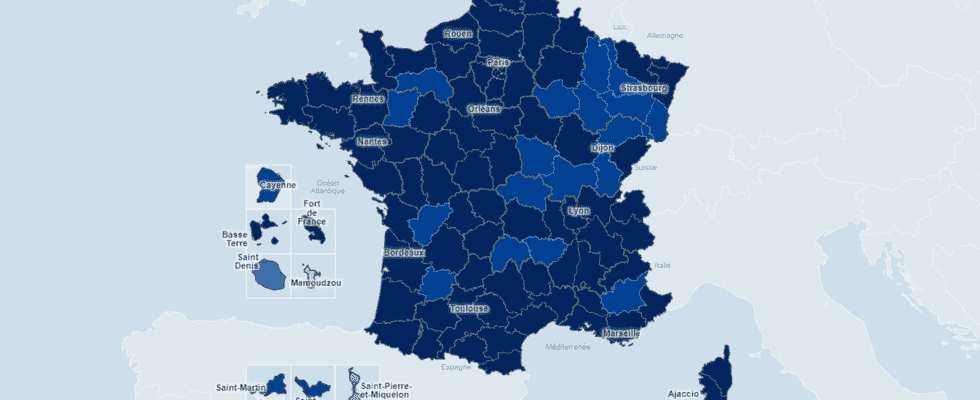
Covid map in France by department
The number of people tested positive for Covid-19 per 100,000 inhabitants over the last 7 days (incidence rate) is a good indicator for understanding the progression of the epidemic. It is closely monitored by the government.
Map of the incidence rate in France
Map of Covid hospitalizations in France
Covid map in Europe

Covid map in the world

► See the animated spread of the coronavirus around the world
Sources
– For French data: dashboard available on government.fr and the GEODES cartographic observatory of Public Health France.
– For international data: maps from the European Center for Disease Prevention and Control (ECDC).