COVID EPIDEMIC CARD. The coronavirus epidemic continues to grow worldwide through the spread of the new Omicron variant. Map of the epidemic in France, contaminations, in Europe, in the world, to travel… Images.
[Mise à jour le 14 janvier 2022 à 16h08] The Covid epidemic continues to progress in France and around the world and is now facing the spread of the Omicron variant, even more contagious than the previous ones (Delta, Alpha, etc.). As of January 6, there are no longer any countries in scarlet red as the Omicron variant has become widely distributed. Which countries are in the red on the European map? In the world ? What situation in France ? Here are the latest images published by French Public Health, the Ministry of Health and the Directorate General for Health and the European Center for Disease Prevention and Control (ECDC) for the outbreak in Europe.
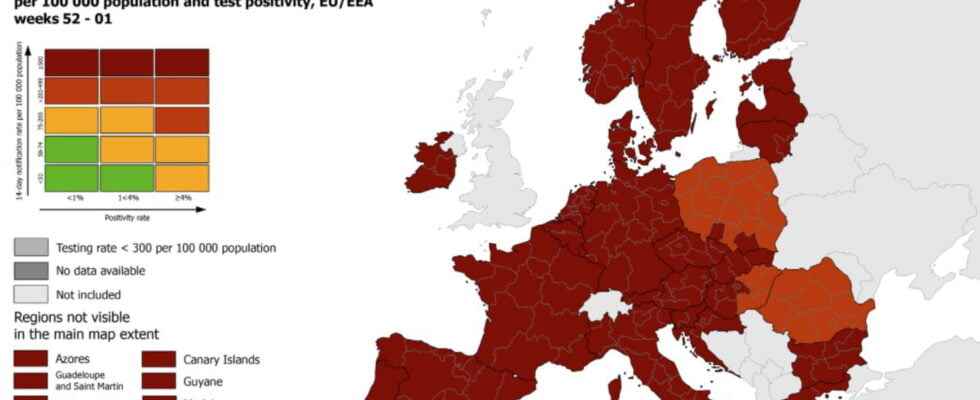
Covid map in Europe
What are the red zones in France?
All of France has gone back to red since November 15, 2021 because the incidence rate there is again above the alert threshold.

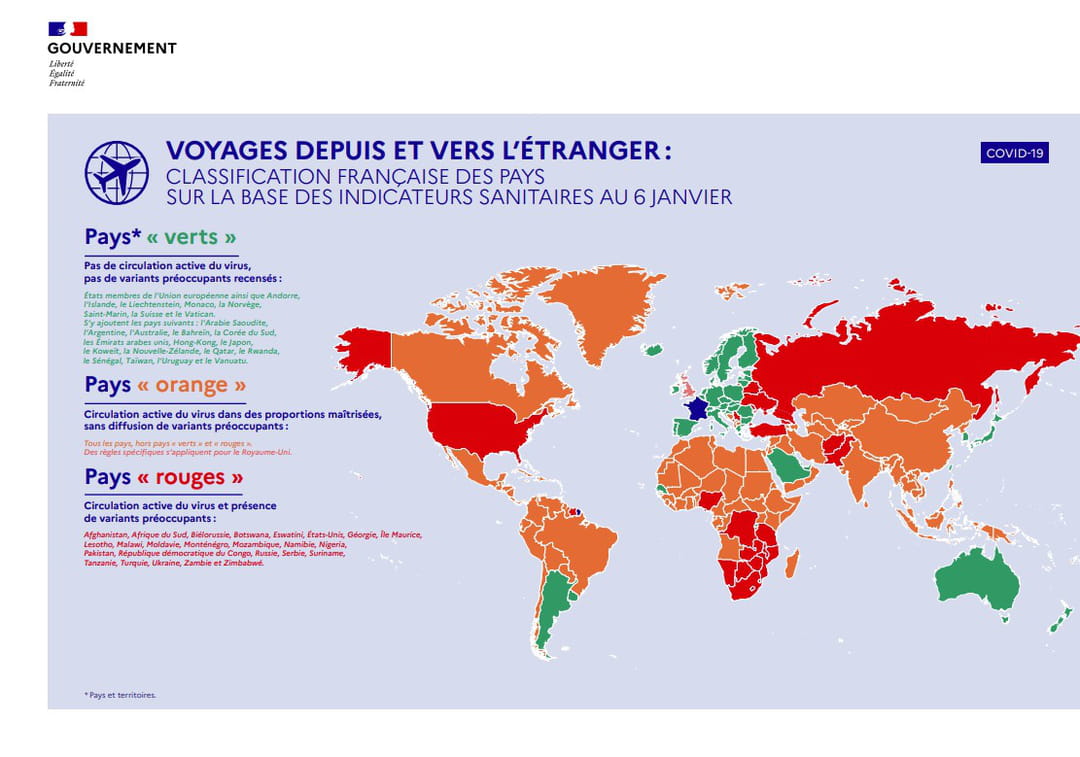
Map of countries for traveling
To deal with the spread of Omicron variant, the classification of countries in green, orange and red has evolved with the addition of a classification “Scarlet”. The map was updated on January 6, 2022 speak government with the countries in green, orange, red according to the health situation. As of January 6, no country is classified as “scarlet red”.
- “Green” countries: no active circulation of the virus.
- “Orange” countries: active circulation of the virus in controlled proportions.
- “Red” countries: active circulation of the virus, presence of worrying variants.
- “Scarlet red” country: particularly active circulation of the virus and/or discovery of a variant likely to present a risk of increased transmissibility or immune escape.
Covid map by department
The number of people tested positive for Covid-19 per 100,000 inhabitants over the last 7 days (incidence rate) is a good indicator for understanding the progression of the epidemic. It is closely monitored by the government.
Covid map by region
Below is the map of France showing the incidence rate (number of people tested positive for the Sars-CoV-2 virus per 100,000 inhabitants) over a rolling week, all ages combined, in France.
Map of vaccinations by region
Vaccination against Covid-19 continues to accelerate in France. Geodes has provided a map listing the people vaccinated in each region.
Covid map in the world
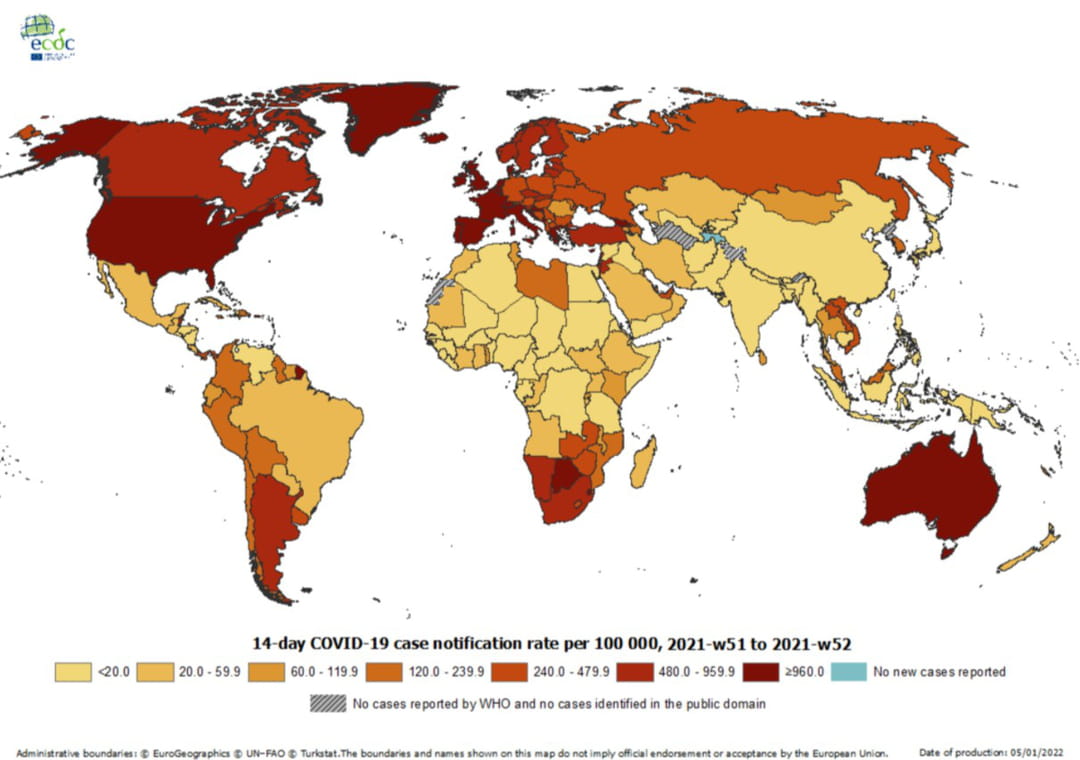
► See the animated spread of the coronavirus around the world
Sources
– For French data: dashboard available on government.fr and cartographic observatory GEODES of Public Health France.
– For international data: maps from the European Center for Disease Prevention and Control (ECDC).