FRANCE COVID SITUATION. The incidence rate of Covid is particularly increasing in 3 regions of France. Here are the maps by departments of the coronavirus situation, as well as the situation in the world.
[Mis à jour le 20 octobre 2022 à 12h59] The circulation of the coronavirus continues on French territory in October. In week 41 (October 10-16), an increase in the incidence rate is still observed according to the latest curve updated by the Geodes site of Public Health France. What is the Covid situation in each department or region of France? What is the incidence rate? For the trips ? In Europe ? In the world ? here are the pictures published by Public Health France (and his website Geodes), the Ministry of Health and the Directorate General for Health and the European Center for Disease Prevention and Control (ECDC) for the outbreak in Europe.
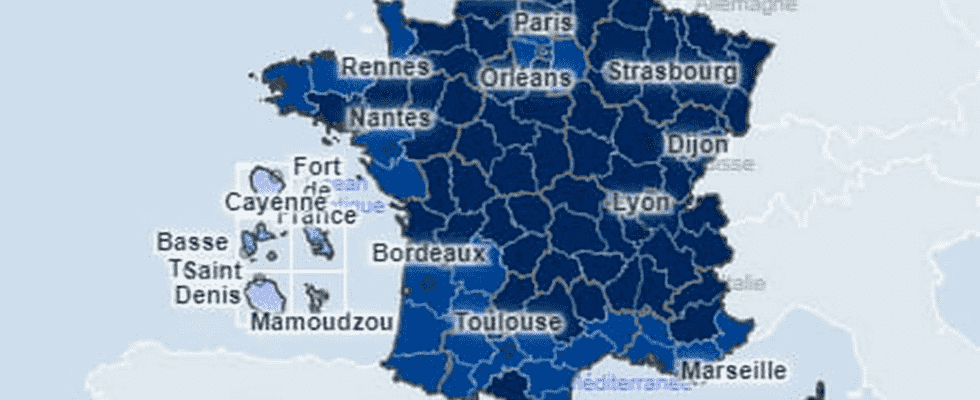
Covid map in France by department
The number of people tested positive for Covid-19 per 100,000 inhabitants over the last 7 days (incidence rate) is a good indicator for understanding the progression of the epidemic. It is closely monitored by the government.
Map of the incidence rate in France
Map of Covid hospitalizations in France
Covid map in the world
Maps of Covid cases and Covid-related deaths around the world are updated by theWHO.


► See the animated spread of the coronavirus around the world
Sources
– For French data: dashboard available on government.fr and GEODES cartographic observatory of Public Health France.
– For international data: maps from the European Center for Disease Prevention and Control (ECDC) and WHO.