COVID-19 FRANCE. More than 108,000 cases of Covid have been reported in France in the figures for this Monday, January 24, 2022. An indicator which continues to progress while the latest assessment, very severe, is close to 400 deaths in 24 hours…
The number of Covid-19 cases detected in the report for this Monday, January 24, 2022 is 108,481 cases in 24 hours. A very low figure, like every Monday following the weekend, but still up by 6,337 cases compared to last Monday. The 7-day average increases to 360,912 cases recorded daily against 360,007 yesterday and the incidence rate to 3,674.63 cases per 100,000 inhabitants in France currently (3,599.79 yesterday). The number of deaths recorded in 24 hours at the hospital is very high on Monday, with 393 dead (excluding Ehpad), i.e. 278 more than yesterday and 95 more than last Monday.
In hospitals, there are currently 29,748 hospitalized patients with Covid-19, a figure still on the rise (+910 compared to yesterday) while 3776 people are in intensive care i.e. 16 more than the day before, breaking the very slight drop in critical care cases observed in recent days. A data always to be taken with precaution the day after a Sunday nevertheless.
Over the past 24 hours, 3,353 patients have been admitted to hospital, 2,259 more than the day before and 538 more compared to last Monday. 337 intensive care admissions were recorded, ie 194 more than yesterday but on the other hand 18 less than last Monday.
Here is the latest official data available on Covid-19 in France according to the daily reports of Public health France and of Data.gouv, based on data from SI-DEP tests, hospital data and feedback from medico-social establishments, including nursing homes. Many clarifications are necessary to properly understand these figures. They are detailed below the table:
PRECISION – Since January 16, the official publication of the total number of confirmed cases since the start of the epidemic (total accumulation) has been suspended “en due to an extension of the data consolidation period”, specifies Data.gouv.
Here is the number of cases of Covid-19, deaths, hospitalizations, resuscitations and cures observed in more or less compared to the previous assessment (generally the day before). Latest data available in France according to daily reports from Public Health France and Data.gouv:
Read also

New cases of covid, test positivity rate, share of the population tested… Linternaute offers you free access to data on the evolution of the epidemic in your municipality. See
From daily data on the coronavirus in France, we have developed several curves which allow us to observe the evolution of the virus according to the number of confirmed cases, the number of hospitalizations and patients in intensive care, the number of deaths in the hospital and total deaths and the number of returns home, assimilated to cures.
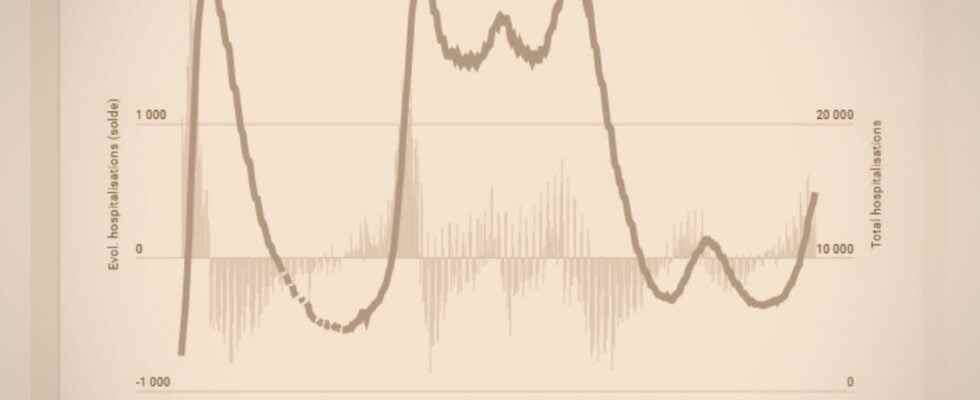
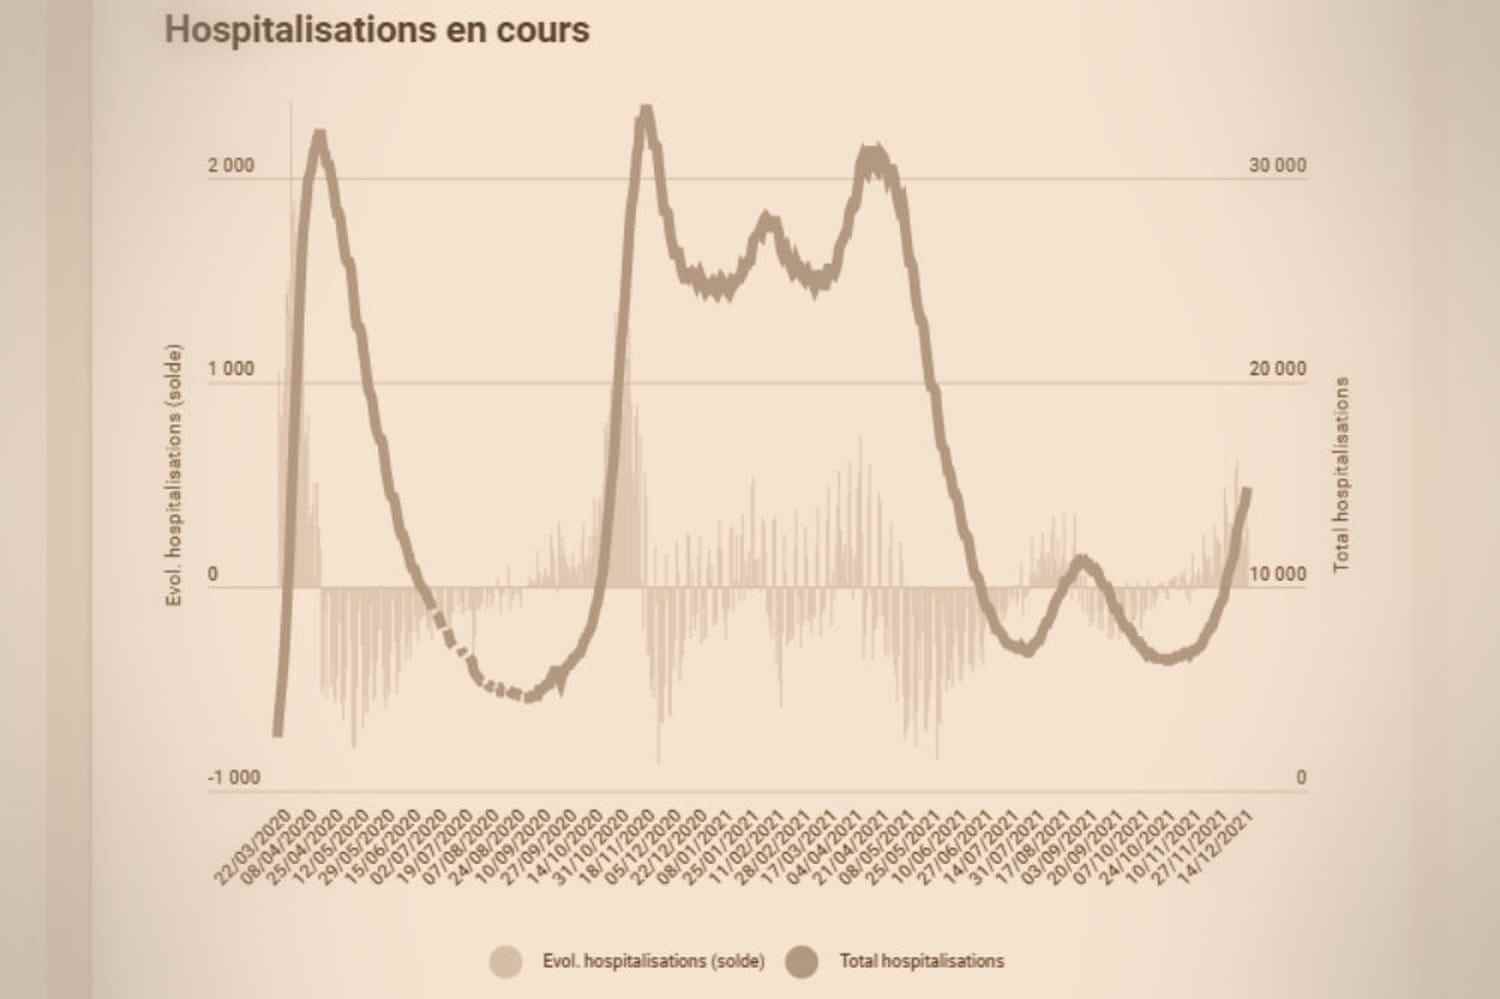
For each graph, the curve represents the total (e.g. total cases, hospitalizations in progress) while the bars correspond to daily changes (balances of hospitalizations each day, new deaths, etc.).
Details on the number of cases: Public Health France specifies that “the data can be very variable depending on the screening activities (reduction of activities on weekends for example, mechanically lowering the number of cases on Monday) and the deadlines for reporting results” (generally 24 at 48 hours). Several changes in the method of recording positive tests may also have disrupted the accounting of cases:
- The government and Public Health France changed their method of collecting data on test results in mid-May 2020, with the SI-DEP project. The figures recorded before and after May 13, 2020 are therefore not completely comparable. Both the quantity and the nature of the tests carried out have greatly evolved. From a few thousand tests at the very start of the epidemic, France went to more than 1 million tests each week and then to 2 million at the start of November 2020, inevitably impacting the figures. In addition, at the height of the first wave, in March/April 2020, the tests mainly concerned seriously ill people, generally admitted to hospital, setting aside all patients with no or few symptoms. The actual number of Covid-19 cases in France was therefore quite significantly higher than the estimated number of confirmed cases during this period.
- Since mid-November 2020, the number of positive tests includes, in addition to PCR tests, the results of antigen tests.
- A duplicate correction was made by Public Health France on May 20, 2021. While there had been more than 5.9 million cases in France since the start of the epidemic, this figure was revised to nearly 5.57 million, or 348,846 fewer cases. A very visible correction on the curve above. others “incidents” on the flow of data have been reported several times by Public Health France.
Details on hospitalizations: it is necessary to distinguish here the evolution of the total number of patients hospitalized at a time T and the new hospitalizations, in other words the new admissions each day to the hospital (gross). In one case, it is a balance, which takes into account admissions, but also discharges from the hospital (healings or deaths). In the other, we are only talking about new admissions to hospital or intensive care with Covid over a day.
Public Health France also specifies that these figures take into account patients admitted to hospital “with” Covid-19 and not “for” Covid-19. They can therefore take into account patients hospitalized for another reason. “Among all Covid-19 patients, the proportion of patients admitted to hospital for a reason other than Covid-19 (but carriers of SARS-CoV-2)” was between 21 and 26% at the beginning of January according to Public Health France.
Precision on the number of deaths: since May 2020, Public Health France no longer updates the balance sheet in Ehpad daily. This report was updated every week at the end of the summer, then several times a week to finally stabilize at a rate of once or twice a week. We therefore initially preferred to erase the number of daily deaths in nursing homes so as not to skew the graphs. At the request of several readers, since November 13, 2020, we are again displaying updates of deaths in nursing homes (dark gray bars) which causes artificial peaks during updates. Data errors and corrections have also been reported on several occasions by Public Health France since mid-March 2020 but also observed at the end of 2021, sometimes resulting in overestimates generally followed by negative changes in the number of deaths.
Read also
The Ministry of Health calculates, from the raw data, a series of statistics on the progression of Covid-19 in the country. Four particularly important indicators are presented below: the positivity rate of RT-PCR tests, the incidence rate, the effective reproduction number and the occupancy rate of intensive care beds. If the first and the last are easily understandable (percentage of positive tests out of the total number of tests carried out and percentage of intensive care beds occupied according to the initial capacities of the country), the other two deserve a definition.
The incidence rate, represented by the second curve, is considered a key indicator of the virulence of the virus. This is the number of new cases of coronavirus diagnosed by PCR test that have occurred over the past 7 days. This figure is related to the number of inhabitants, ie a rate expressed per 100,000 inhabitants.
The reproduction number (R) corresponds to the average number of people infected by a patient. If this figure is greater than 1, it means that a person with Covid-19 infects more than one other person on average and therefore that the disease is progressing.
If you don’t see the infographic, Click here
Precision on the positivity rate and the incidence rate: Public Health France changed its calculation method for its main indicators, which are the incidence rate and the test positivity rate on December 8, 2020. The addition of antigenic tests in the first indicator then mechanically inflated the result of the calculation. . The positivity rate has dropped drastically. The reason this time comes from the counting of negative tests: if the same person has carried out several tests within 60 days and these are negative, each of them is now counted. Previously, if a person tested negative several times in a row within 60 days, only the first test was counted. It was only in the event of a positive test that his situation changed.
Public Health France explained in a press release that this new method of calculation proved to be more precise because it takes into account the “prevalence of the virus in the population tested”. “Today, as the epidemic continues, it is common for the same person to carry out several tests, especially when the previous ones were negative. In addition, knowledge has evolved and the risk of reinfection, which today is considered very low but possible after 60 days, must be able to be identified”, wrote the health agency at the time.