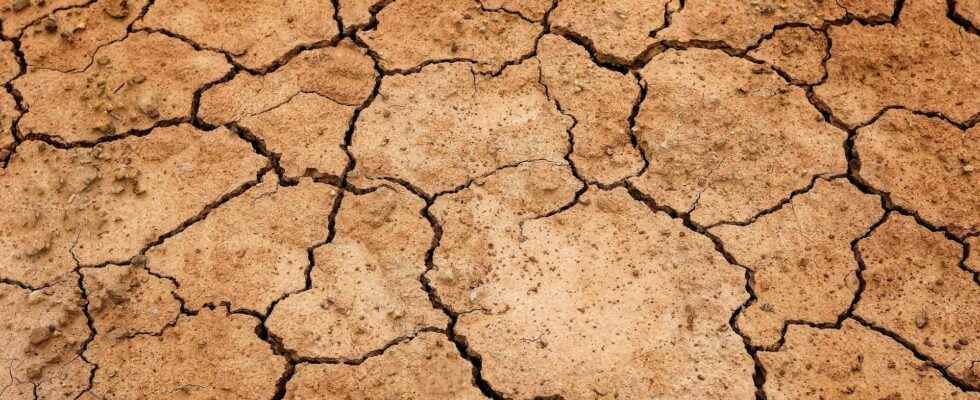
For researchers, leaders of this world, but also the general public, Google provides Dynamic World, an online application, which displays almost real-time soil changes based on environmental events.
You will also be interested
[EN VIDÉO] Earth is darkening due to global warming and that’s not good news For 20 years, the albedo of the Earth has decreased by 0.5%. As it reflects less solar radiation, the planet will absorb more heat, which risks aggravating global warming.
DynamicWorld. This is the name given by Google to its new tool for exploring our planet, created in collaboration with the World Resources Institute. Kind of overlay of Google Earthwhich makes it possible to observe the earth in 3D from its mobile or his computer, this data set displays, almost in real time, the characteristics of the earth’s surface. More concretely, it is now possible to show the state of the soils, and their compositions such as treescrops or water.
Usually, designing this type of card takes time, and we are talking about weeks or even months. To achieve an almost real-time display, with more than 5,000 images added per day, Google relies on satellite images but also on artificial intelligence. In total, for each parcel of land of approximately one are (100 m²), Google displays the probability that it is covered by one of nine types of cover: water, flooded vegetation, buildingstrees, crops, bare ground, grass, shrubs/brush and snow/ice.
Objective: to observe and anticipate trends related to climate change
As Google explains in an article published by the prestigious newspaper Naturethis data is essential for researchers and world leaders to quickly observe the impacts of environmental events such as fires, floods where the hurricanes and better respond to soil changes, mainly due to climate change. In the tool, four events are pre-recorded to observe, using the mouse, before and after.
Thus, researchers can create their own maps based on the results of Dynamic World, and combine them with local information. The goal ? Google gives the example of a map to analyze harvests between particular dates, or to understand longer-term trends of seasonal changes in theecosystem.
Special offer: for Father’s Day, offer the best of Science!
Your father is a great science enthusiast and unusual discoveries? And if you offer him a superb scientific exploration in paper format? Benefit from -20% on the Mag Futura (special offer: €15 instead of 19 €): 220 pages to explore 4 scientific issues that will shape our future!
Mag Futura is:
- 4 major scientific questions for 2022, from the Earth to the Moon
- 220 pages, 60 experts: no fake news, just science
- Home delivery with electronic gift card
- An independent scientific media
Interested in what you just read?
