To control your PC, keep an eye on the occupation rate of the processor, the graphics circuit, the RAM, the disk and the network: you will thus be able to identify in real time the causes of slowdown or blocking.
Using a computer is a bit like driving a car: better keep an eye on the speedometer. Admittedly, the analogy is somewhat crude, in that there is no speed limit to respect. But the idea remains valid: it is good to know what is happening under the hood, especially when the PC shows signs of shortness of breath due to overload, to identify the cause. This is the case, for example, when the processor is used at 100% of its capacity by a greedy task in software or when the memory is saturated by too many tabs open in a Web browser.
For this, Microsoft has provided Windows 10 with a very practical tool: Task Manager. Acting as a real dashboard, this utility integrated as standard into the system can indicate in real time the rate of use of the main hardware resources, in this case, the processor (CPU for short), the random access memory (Ram) , the storage system (hard disk or SSD), the network (Ethernet or Wi-Fi) and the graphics circuit (GPU). This tool is easily accessible, but it has the disadvantage of occupying a fairly large area on the screen, thus preventing you from simultaneously seeing the influence of the various manipulations performed in the other open software.
This is precisely the reason why it can be practical to use another utility signed Microsoft: the Xbox Game Bar (or Xbox game bar, in French). Originally designed for video games, this tool has very practical control functions that can be used without even playing to monitor the use of certain components: the processor, the RAM and the graphics circuit. The advantage is that this module can be reduced to a small discreet dashboard displayed without interfering with other open applications.
- Integrated into Windows for several versions, the Task Manager allows you to see in time the occupancy rate of the main elements of a PC.
- Right click on a free area of the taskbar of Windows 10 then, in the pop-up menu that appears, click on Task Manager. You can also open it directly with the keyboard shortcut Ctrl + Shift + Esc.
- The window Task Manager is displayed. Then click on the tab Performance.
- The window then displays monitors showing in real time the activity of the main elements using graphs, percentages and various information.
- For example, click on the thumbnail Processor, to the left. The right part of the window then shows the evolution of its activity, its utilization rate, the number of processes in progress as well as certain technical characteristics (speed, number of cores, cache memory, etc.).
- Similarly, click on another thumbnail (Memory, Disk, etc.) to see the associated statistics.
- If you want to identify the programs that draw the most on your PC’s hardware resources, click on the tab Process.
- The content of the window changes, this time displaying the list of open software with, for each, the details of the resources used. Expand the window or use the horizontal scroll bar if you want to see everything.
- For more details on a particular software, click on the little arrow in front of his name. The list of the different processes, windows or tabs that it uses is then displayed, with, for each, the resources used.
- All this information allows you to identify the most greedy software and processes. If you see, for example, that an application is taking up 100% of the processor resources, you just have to close it to find some air. Ditto for tabs in a web browser. Or for software that requires 100% of the disk to be read or written.
The other way to monitor the activity of major PC components is through the Xbox Game Bar. In principle, it is installed by default with Windows 10. But it may also have disappeared if you have uninstalled software that you consider unnecessary, as we explained in our fact sheet Removing unnecessary software from Windows 10.
- To find out, click on the menu To start up and browse the list of available software, organized alphabetically.
- If you see Xbox Game Bar, you can go directly to the next step.
- Otherwise, you have to install it manually. To do this, type the keyboard shortcut Windows+G.
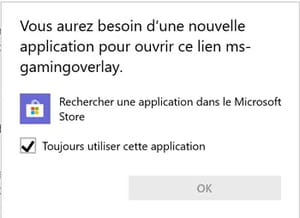
- A window indicating that you are missing a module is displayed. Click on okay.
- The Microsoft Store window opens, offering to download the Xbox Game Bar. Click on To install.
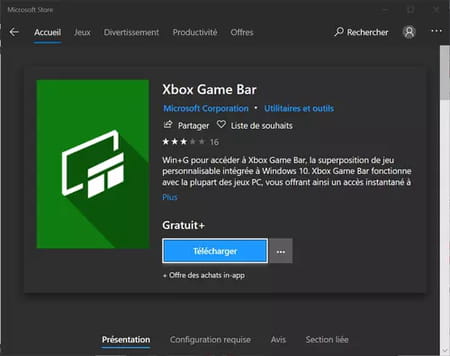
- Wait while downloading and installing.

- At the end of the installation click on Throw to open the Xbox Game Bar or close the window, and go to the next step.

Unlike Task Manager, Xbox Game Bar requires some preliminary settings. It is made up of different modules originally planned for video games: only the module module Performance provides information on the use of PC hardware resources by indicating the rate of use of the processor, RAM and graphics circuit. When set correctly, it will stay superimposed in a corner of the screen and help you monitor your PC.
- When Xbox Game Bar is installed on your PC, type the keyboard shortcut Windows+G to open it.
- The first time Xbox Game Bar launches, it displays a splash screen. Click on okay to make it disappear.
- Several small windows are displayed: Audio, Capture, Xbox Social and Performance. Close them all by clicking on their closing box and leave only Performance open: it is the only one that interests us here.
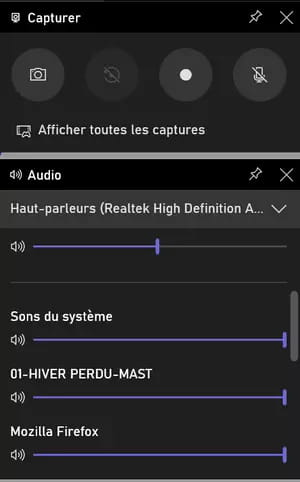
- Note that the Xbox Game Bar itself appears as a control bar at the top of the screen, along with the time. It includes buttons associated with each of the aforementioned modules. You can at any time click on one of these buttons – which operate in switch mode – to display or hide the corresponding module. So click on the button representing a screen with a graphic to show or hide the module Performance.
- As long as the Xbox Game Bar is visible, the rest of the screen is grayed out: this is normal. Above all, do not click on another area of the screen, otherwise it will disappear. If this happens anyway, type the keyboard shortcut again Windows+G to make it reappear.
- Move the module window Performance to drop it off at the location of your choice.
- Once it is positioned to your liking – you can always move it again later – click on pin icon in its title bar so that it remains permanently displayed on the screen, superimposed – that’s all its interest!
- Then click on the button with three slidersin its title bar.
- The window Performance options is displayed. It allows you to adjust the various parameters of the Performances module.
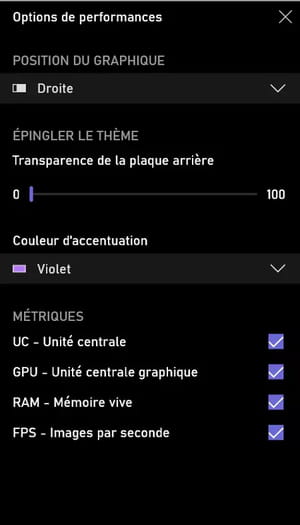
- Click on the arrow located under Chart position. A pop-up menu appears with three options: Low, Left and Right. Click on Rightfor example, if you want real-time graphics to display on the right side of the window.
- In the section Pin thememake it slide the cursor located under Backplate Transparency to render the background of the window Performance more or less opaque – it’s a matter of taste and readability.
- In the section Accent colorclick on the arrow and select a color for statistics and graphs.
- In the zone Metricstick boxes corresponding to the elements that interest you: CPU for the processor, GPUs for the graphics circuit, RAM for RAM and FPS for the number of frames displayed per second – only useful in video games.
- Finally close the window when you have finished your settings.
- You can then use your PC normally. The window Performance will always be visible where you put it, displaying real-time CPU, RAM, and GPU load rates – if that’s what you’ve chosen.
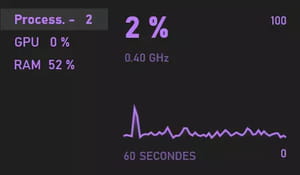
- If you want to reduce the size of the Performance window, click the little arrow next to 60 seconds. The graph will disappear and only the percentages will be displayed.
- To stop displaying the module Performancetype the keyboard shortcut Windows+G to bring up the Xbox Game Bar, then click the closing box from the window. You can always reopen it the next time you need it.


