Local real estate officials are reporting a sharp drop in August home sales compared to last year.
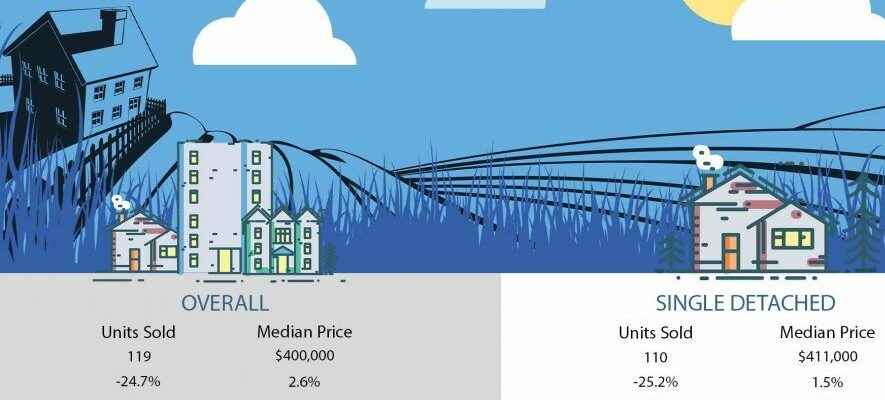
The number of homes sold through the MLS system of the Chatham-Kent Association of Realtors totaled 119 units last month.
This was a decline of 24.7 per cent from August of 2021. Home sales were 15.8 per cent below the five-year average and 11.8 per cent below the 10-year average for the month.
On a year-to-date basis, home sales totaled 985 units over the first eight months of the year. This was a drop of 19.7 per cent from the same period last year.
“Our region’s housing market continued to moderate in August, partly due to the rapid rise in mortgage rates seen throughout the year that has eroded affordability,” Amber Pinsonneault, association president, said in a release Thursday.
“The slowdown in sales, coupled with an increase in inventory on the market, have brought market conditions closer to balanced levels and we are starting to see a softening in prices. There are now more options to choose from for those buyers who are still looking to enter the market.”
The average price of homes sold last month was $421,638, a decline of 2.1 per cent from August of 2021.
The more comprehensive year-to-date average price was $482,108, up by 18.9 per cent from the first eight months of 2021.
The dollar value of all home sales in August of this year was $50.2 million, a decrease of 26.2 per cent from the same month last year.
The number of new listings saw a moderate gain of 4.4 per cent (10 listings) from August of 2021. There were 239 new residential listings last month. This was the largest number of new listings added in the month of August in 15 years.
New listings were 23.3 per cent above the five-year average and 30.7 per cent above the 10-year average for the month of August.
Active residential listings numbered 375 units on the market at the end of August, a gain of 93.3 per cent from the end of August 2021. Active listings haven’t been this high in the month of August in more than five years, the association added .
Active listings were 58.6 per cent above the five-year average and 1.9 per cent below the 10-year average for the month.
Months of inventory numbered 3.2 at the end of August, up from the 1.2 months recorded at the end of the same month last year and above the long-run average of 3.1 months for this time of year.
The number of months of inventory is the number of months it would take to sell current inventories at the current rate of sales activity.
